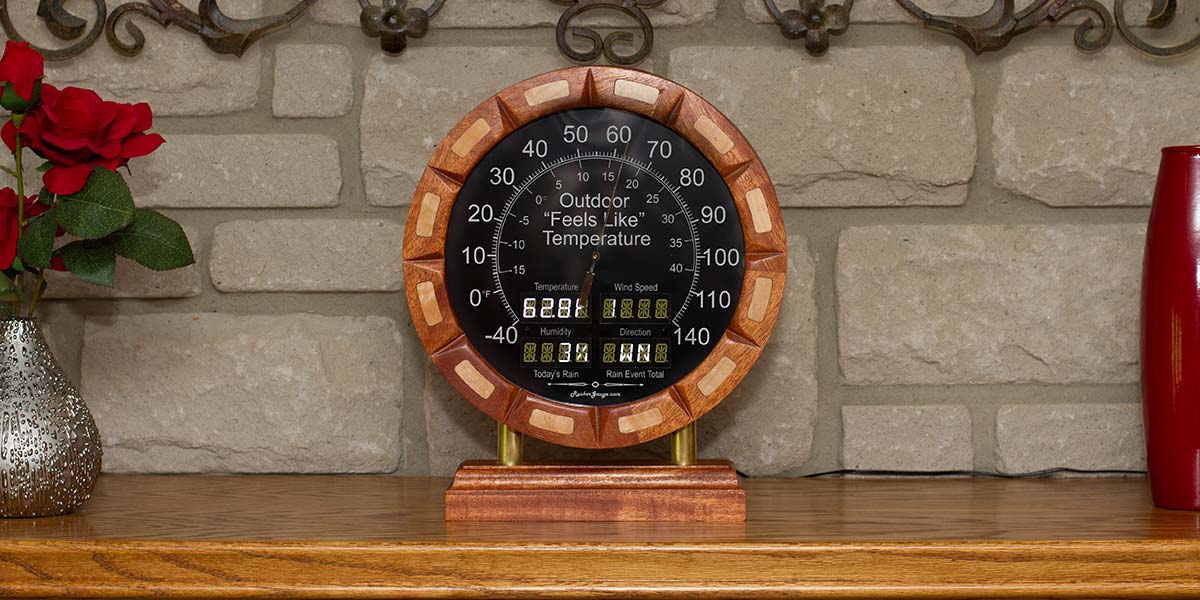
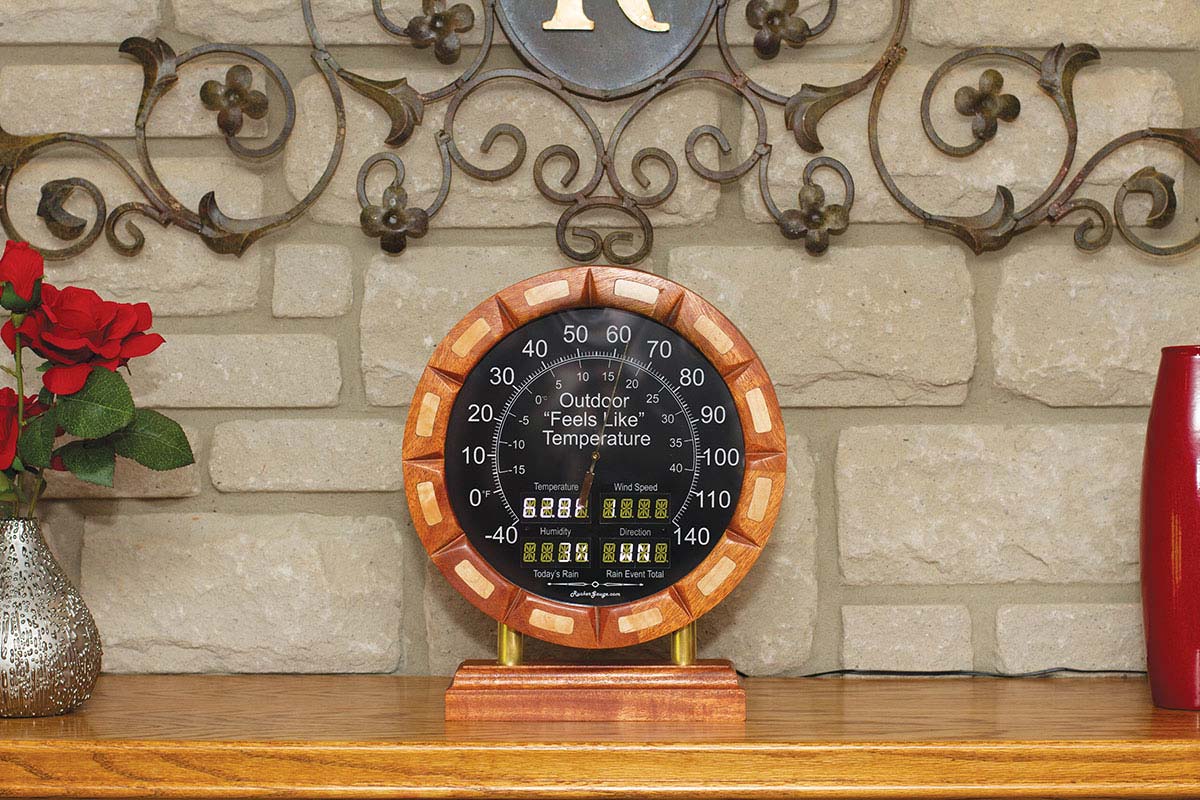
This fun, elegant, and useful project pulls data from the Internet so a series of useful displays can show all kinds of cool info in real time from your mantel or bookshelf in this impressive platform.
In our previous article, we discussed the circuit and code for each of the core components for our Weather Gauge. We took a deep dive on how the stepper is wired up and the node.js code that drives it. Now, it’s time to put it all together and light it up in this final installment.
This fun, elegant, and useful project pulls data from the Internet so a series of useful displays can show all kinds of cool info in real time from your mantel or bookshelf in this impressive platform.
In this first article of a two-part series, we’ll discuss the circuit and code for each of the core components for the weather; take a deep dive on how the stepper is wired up; then learn about the node.js code that drives it.
I’ve enjoyed tracking wind speed for years with my Davis weather station. However, the tiny plot on the station’s LCD screen is not very resolved and I wanted it to be better ... a whole lot better. The solution: a Raspberry Pi!