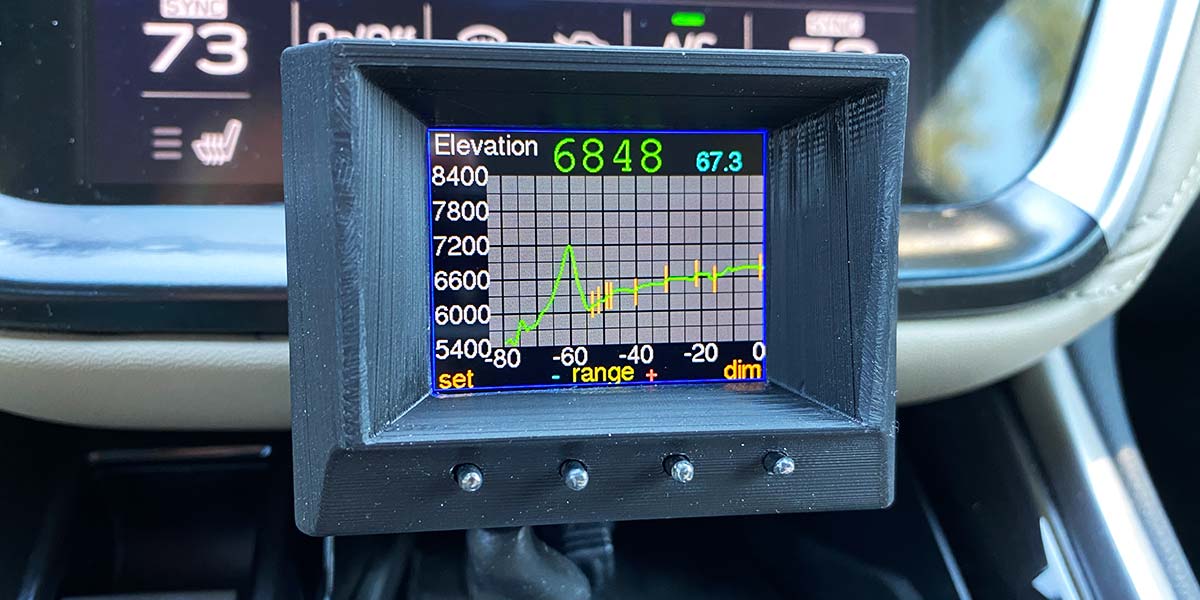
I think it’s fun to know the altitude where I am. While travelling, it’s difficult to pay close attention to the elevation of each moment, and this graph allows me to see where I have been in elevation. I can enjoy the peaks and valleys of my journey, even if I wasn’t able to view the readings at those particular moments.
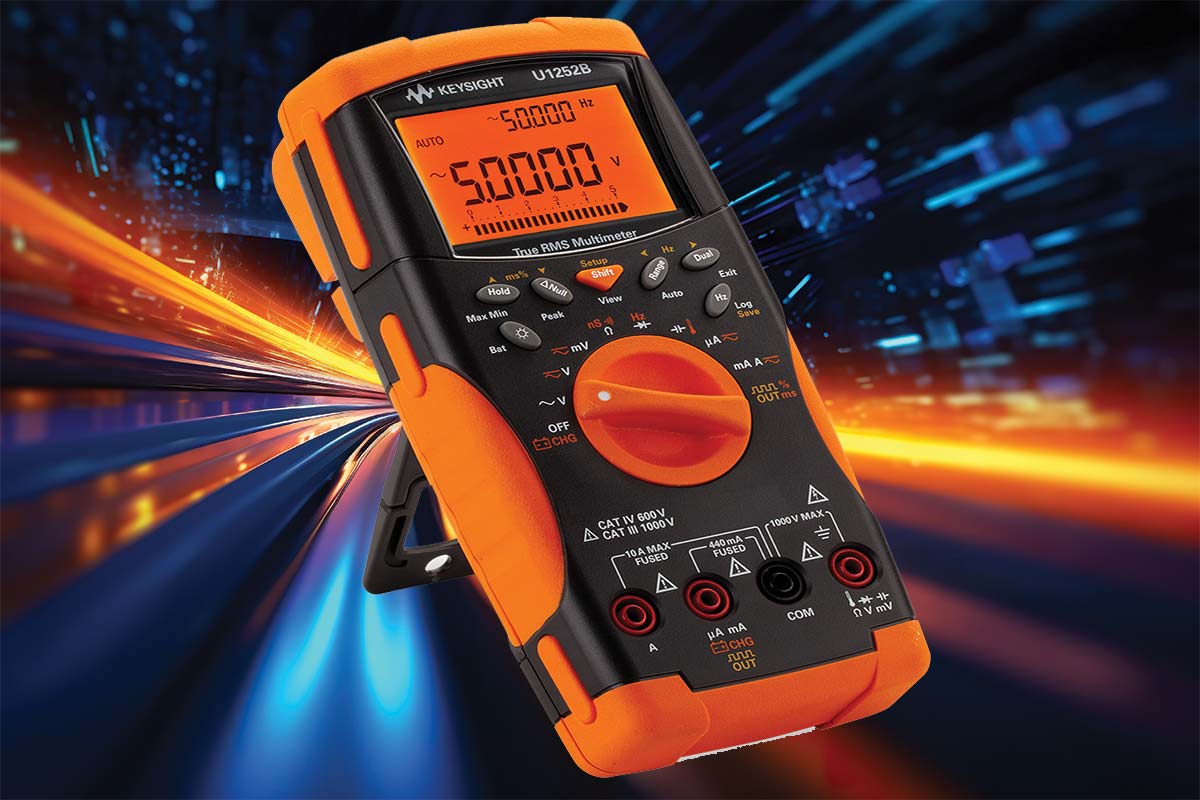
By extending the life of a multimeter with a faded OLED screen with the help of Python and an Arduino, we’ve created a multimeter-based data logging system, with the multimeter functioning as a high-end measurement engine.
This system monitors motion from a USB webcam on a Raspberry Pi 3 using the OpenCV API. Once movement is detected by the system, it takes a picture of what set the motion detection software off and emails that picture to you. It also affords you the ability to remotely view the webcam from an Android application from anywhere in the world at any time.
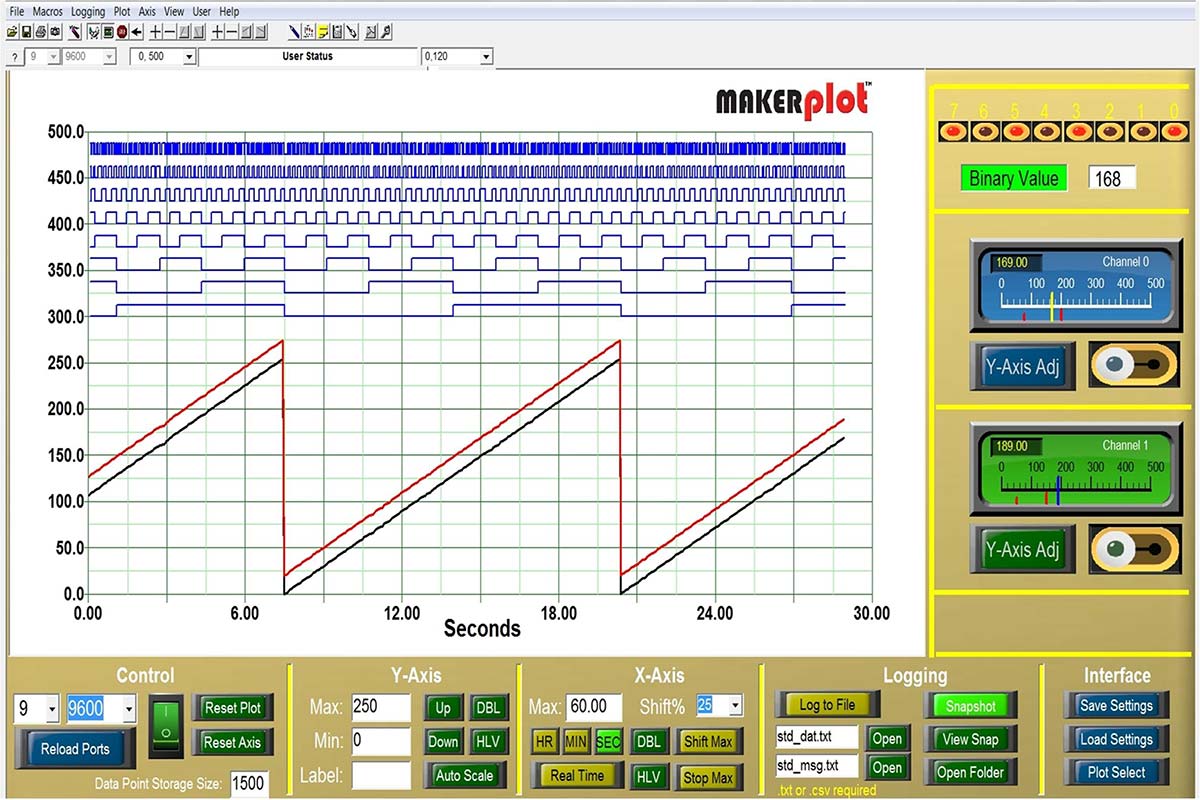
If you use microcontrollers in your projects, imagine how helpful it would be to see the data in a graphical format, rather than just a series of numbers -- especially when debugging! MakerPlot does all of this and connects directly to your microcontroller’s serial port to display analog and digital data in graphical form; it’s DIY software for your microcontroller projects.
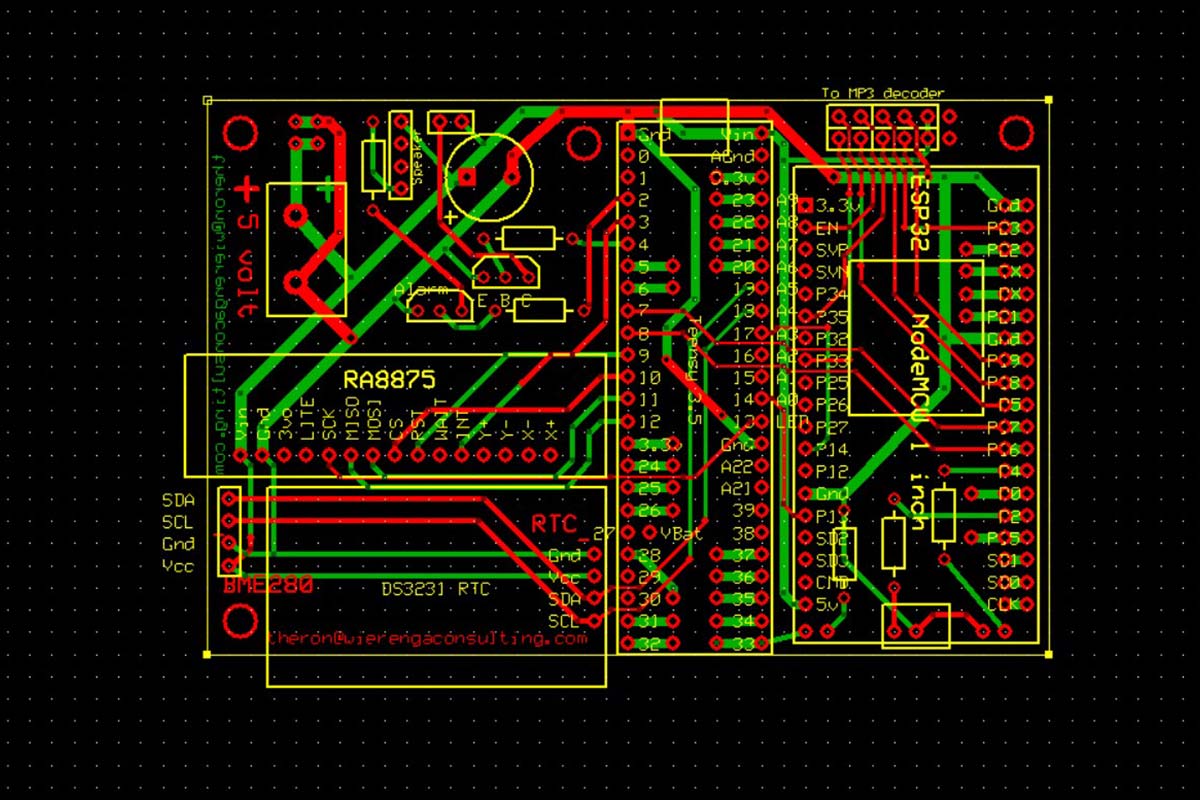
After creating an Internet connected digital clock using the Adafruit RA8875 driving an seven inch LCD display, I decided to step it up a notch and add several additional features including: the ability to set an alarm; a countdown timer for uses like monitoring an exercise program; a weather display to provide brief conditions at 10 different cities; a real time stock market report that gives the changing prices for a selection of stocks; and lastly (just for fun), a Mandelbrot fractal generator to produce those wonderful images.
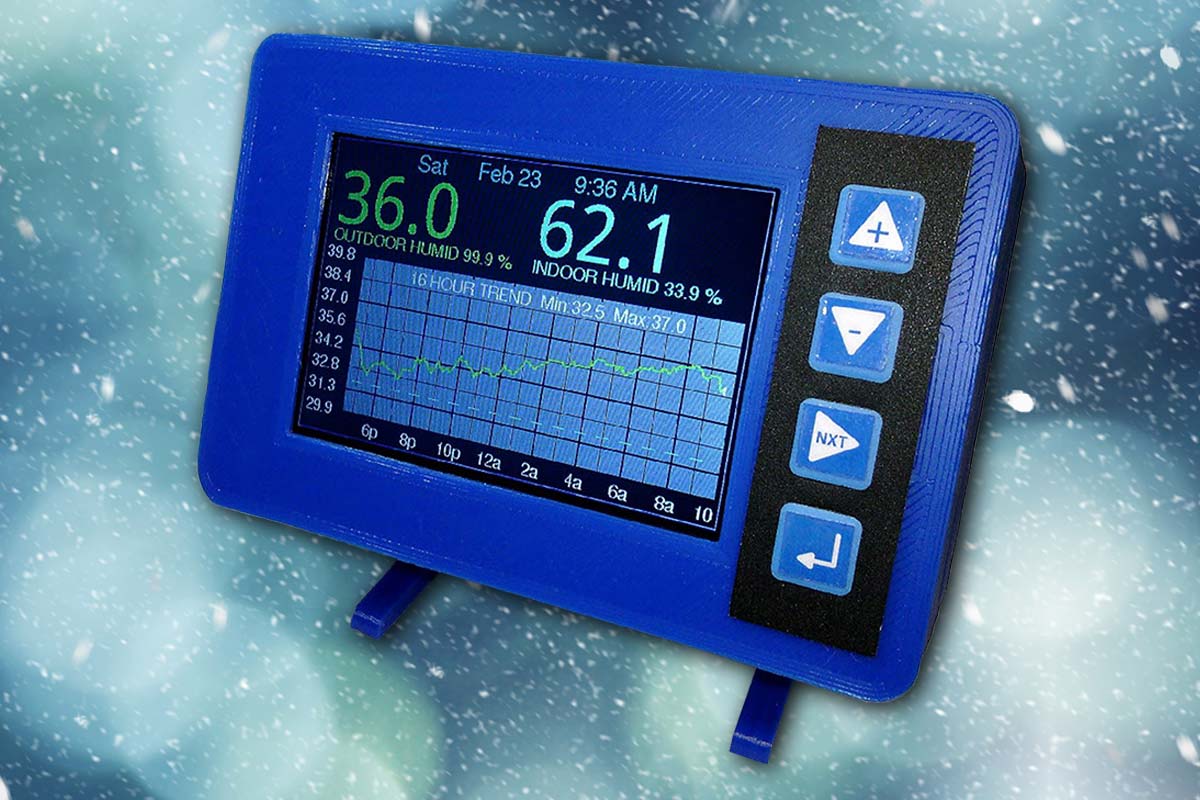
Recently, I began to explore ways to improve and upgrade my “thermal monitoring technology” and came up with this simple, easy to build trend-plotting thermometer. This project features a large color graphics display to show the current temperature in big bold digits. Better than that, it also graphs the temperature trends over the most recent 4, 8, 16, or 24 hour period.
Whether it be temperature trends, time and date, current/voltage readings, battery status, or other variables, consider giving your next project some extra pizazz by including an LCD color graphics display into the design!
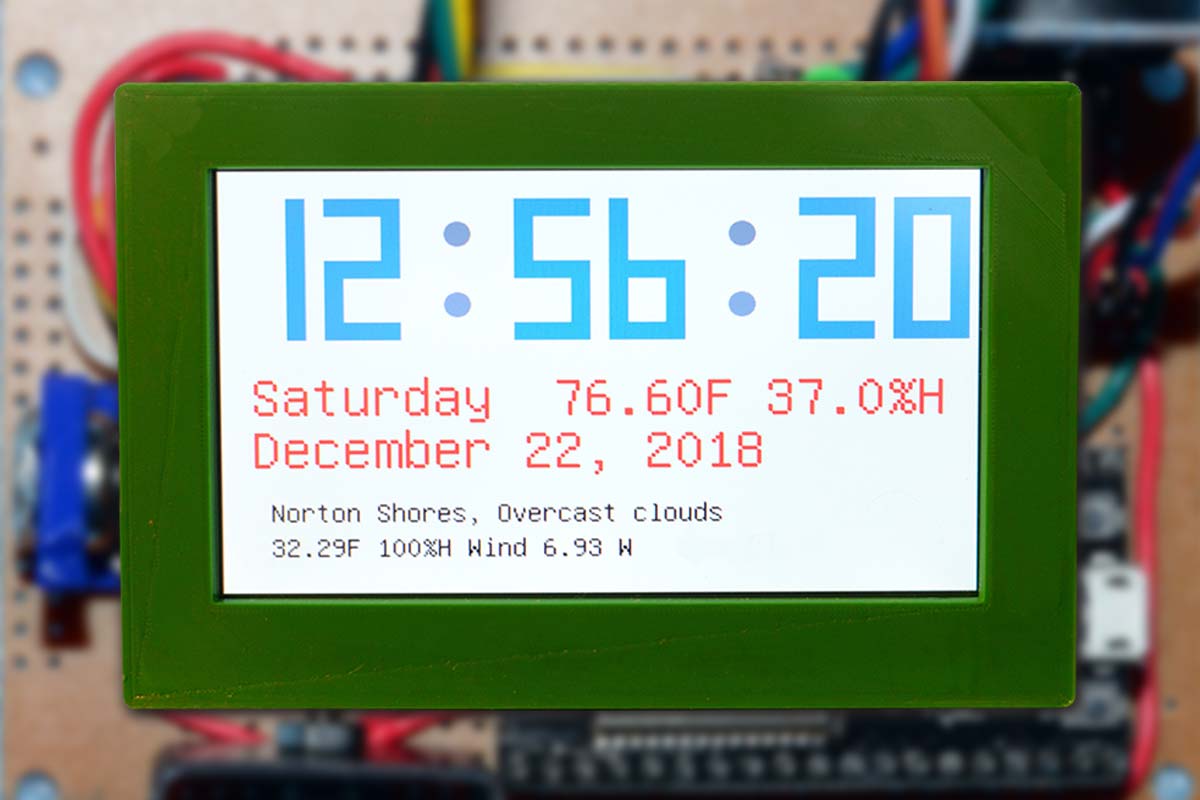
The advent of the ESP32 Wi-Fi development boards allows for an increase in the sophistication of a digital clock. It doesn’t take much imagination to envision a digital clock with a large LCD display to not only show the usual time, date, temperature, and humidity, but to also be able to retrieve things from the Internet like the weather or weather forecast, and stock market reports as well. This seven inch clock also automatically corrects for Daylight Saving Time.