This article discusses the “ins and outs” of interfacing analog sensors to a microcontroller’s analog-to-digital converter (ADC) input pins1. As shown later in Table 1, a great number of sensors produce a voltage output that varies in response to a change in a physical parameter such as temperature, pressure, or magnetic field intensity. Voltage output sensors with low output impedance can usually be connected directly to an ADC, although some applications may require signal processing to amplify and or shift the signal to make use of an ADC that can’t handle negative-going inputs2. However, those devices with a high output impedance (such as most piezoelectric products) will generally require signal buffering3 before being connected to an ADC, oscilloscope, or other measurement device.
1. The Arduino Uno offers six channels of 10-bit ADC, but higher resolution ADCs (typically 12-bit) and more channel options can also be found in recent Arduino microcontroller releases as well as in add-on ADC shields and modules using serial interface methods (e.g., I2C and SPI).
2. Arduino ADCs can only handle a range of zero to five volts (3.3 for the Due and Zero).
3. Signal buffering converts a high-impedance to a low-impedance output; for example, using a “voltage follower” circuit.
As noted, an electronic sensor measures a physical phenomenon such as temperature, humidity, acceleration, velocity, position, movement, voltage, current, resistance, pressure, flow, or force, and provides a corresponding output usually in the form of an analog electrical signal. In each of these categories, several sensor subtypes may exist. For instance, depending on the application specifics, flow sensors may variously use axial turbine technology which translates turbine rotation into a rate of flow; ultrasound technology based on the Doppler principle (commonly used in blood flow measurement); the use of the Coriolis effect (used where very high accuracy is needed); as well as many other possible measurement methods.
Sensors can be wired or wireless, feature analog or digital outputs, and have linear or nonlinear characteristics. As an example, a thermistor is a wired temperature sensor with nonlinear resistance characteristics, while the Texas Instruments LM35 sensor (http://www.ti.com/lit/ds/symlink/lm35.pdf) is a wired temperature sensor with a linear analog voltage output. The Maxim DS18B20 (https://datasheets.maximintegrated.com/en/ds/DS18B20.pdf) is a linear wired temperature sensor featuring a single-pin digital output that requires only one input pin (plus a ground pin) for communication.
If wireless temperature monitoring is required, a variety of products are available from Omega (https://www.omega.com) or from other vendors; these wireless sensor products may use Wi-Fi or Zigbee technology or even use GSM mobile phone technology.
Three types of analog sensors will be discussed here: [1] sensors that change their output voltage in response to changes in a physical property like angular position, temperature, pressure, or light intensity (e.g., Figures 1-3); [2] those that change their resistance with changes in a physical property; and [3] piezoelectric sensors — voltage output devices whose high-impedance outputs often require the use of field-effect transistor (FET) signal conditioning circuitry. Not discussed are less commonly used sensors that change capacitance or inductance with changes in a physical property.
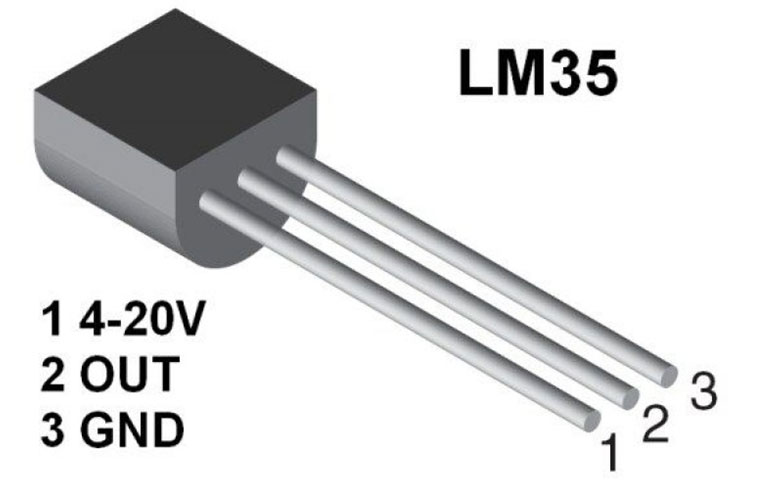
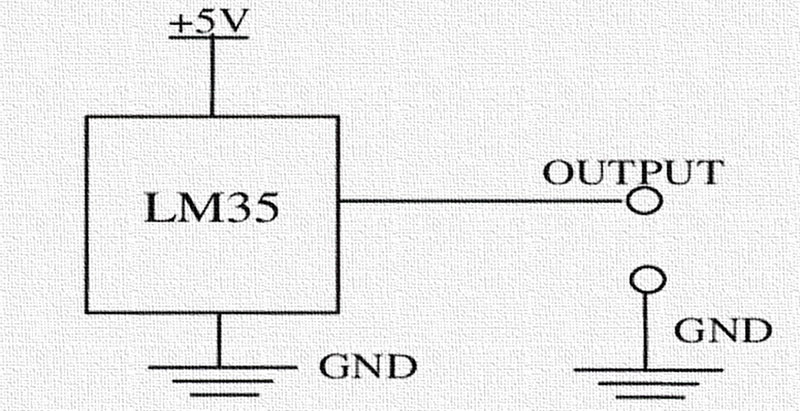
Figure 1. Useful in various industrial and biomedical applications, the three-pin LM35 temperature sensor produces an analog voltage output linearly proportional to temperature in the range of −55°C to 150°C and with a sensitivity of 10 mV/°C. Additional information is available at https://www.ti.com/lit/ds/symlink/lm35.pdf.
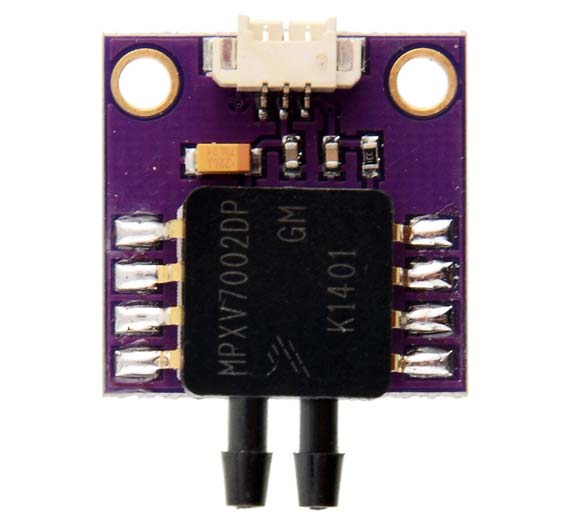
Figure 2. This differential pressure module is useful in many industrial and biomedical applications. It’s based on the MPXV7002 chip and provides a high-level analog output signal proportional to the pressure difference between the two ports. The module is powered by a five volt source and produces a 0.5V to 4.5V output corresponding to the range -2 to 2 kPa (-0.3 to 0.3 psi). Additional information is available at https://www.amazon.com/Breakout-MPXV7002DP-Transducer-Differential-Pressure/dp/B01MCVOZJO/.
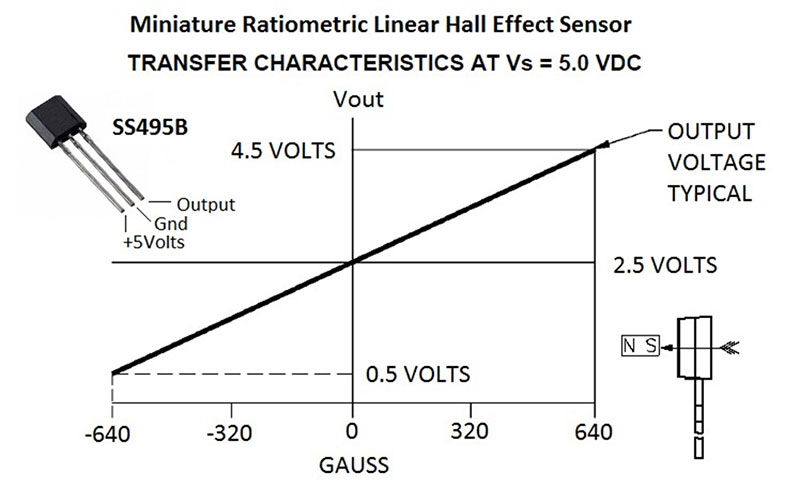
Figure 3. Used in many industrial and biomedical applications, the three-pin SS495S Hall effect sensor produces an analog voltage output linearly proportional to magnetic field strength.
Many sensors are resistance-based and vary their electrical resistance with a physical property such as force, light intensity, temperature, or pressure. Some decrease their resistance (increase their conductance) with an increase in the physical property they are sensing; examples include many thermistors and light sensors.
The opposite is the case for some other sensors or transducers. For example, consider a strain gauge or load cell that utilizes an electrical element whose length increases and cross section decreases in response to increased tension; the result of which is that the resistance of the element increases.
Microcontroller Analog Inputs
Many microcontrollers feature ADCs. For example, the popular Arduino Uno supports six analog inputs with a 10-bit ADC, with a voltage input range of zero to five volts. By contrast, the Arduino Zero, the Arduino Due, and many other recent microcontroller releases feature a voltage input range of 0 to 3.3 volts with 12-bit ADC resolution. This corresponds to a range of 0 to 1023 for the 10-bit models or 0 to 4095 for the 12-bit Arduino models. The Arduino Portenta H7 has a 16-bit ADC, supporting values between 0 and 65535.
On the Arduino Uno, the value of an Arduino analog input is read using the analogRead(analogPin) command, where “analogPin” denotes the input pin to read from (0 to 5 for basic Arduinos, 0 to 7 on the Mini and Nano Arduinos, and 0 to 15 on the mighty Mega Arduino). For example, for the Arduino Uno, the code to read the input voltage on pin 3 might be:
int analogPin=3;
float scalefactor=5.0/1023.0;
float voltage=analogRead(analogPin)*scalefactor;
where “scalefactor” converts the obtained ADC value to volts.
Potentiometers
Classic potentiometers can be viewed as angle sensors in the sense that their resistance varies with the angle of shaft rotation. These devices consist of a wiper contact and a circular resistive track, and can be configured either to increase resistance with clockwise angular rotation or to decrease resistance with clockwise rotation.
While ordinary potentiometers have an angle range of around 270 degrees, another variant known as “multiturn” potentiometers are commonly used where greater precision is needed or are used to “trim” electronic circuits; for example, to produce an exact zero output in an operational amplifier (op-amp) under zero input circuit conditions.
Additionally, so-called “slider” potentiometers change their resistance depending on the degree of linear displacement of the control handle (Figure 4).
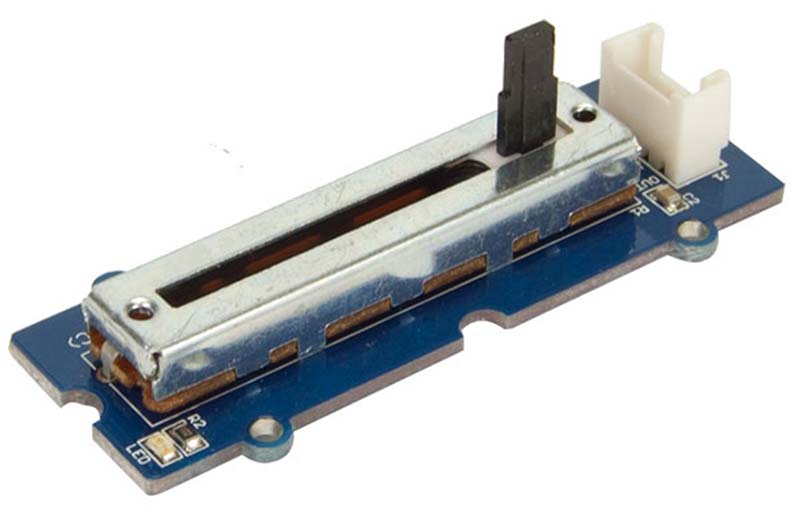
Figure 4. “Slider” potentiometers such as that shown here change their resistance depending on the degree of linear displacement of the handle. These devices are sometimes called “faders.”
These potentiometers are sometimes called “faders.”
Potentiometers are often used in a voltage divider arrangement as illustrated in Figures 5 and 6.
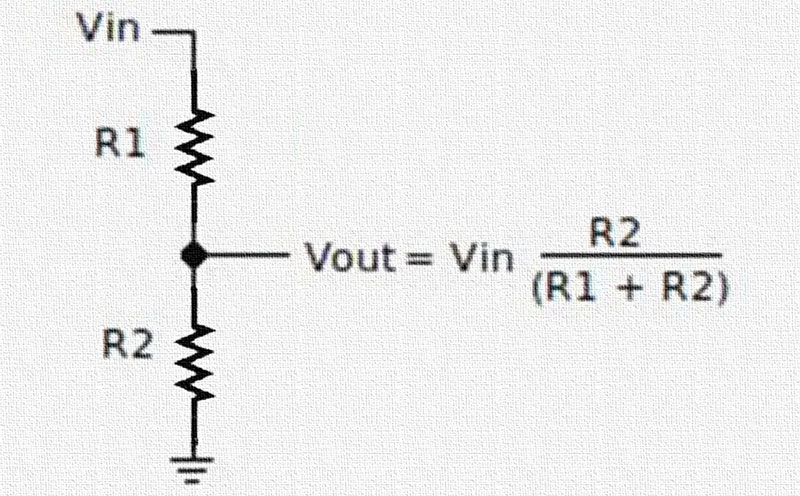
Figure 5. A voltage divider circuit consisting of two resistors in series and supplied by a voltage Vin (typically set to five volts in Arduino systems). Such a voltage divider circuit allows one to convert changes in sensor resistance to changes in voltage. If R1 has a variable resistance and R2 has a fixed value, then decreases in the resistance of R1 will produce increases in the output voltage (denoted Vout). This would be a TYPE A circuit arrangement. Alternately, if R1 has a fixed value and R2 varies, then increases in R2 will produce increases in the output voltage Vout (TYPE B circuit). In most older Arduino designs, Vin would be chosen to be five volts.
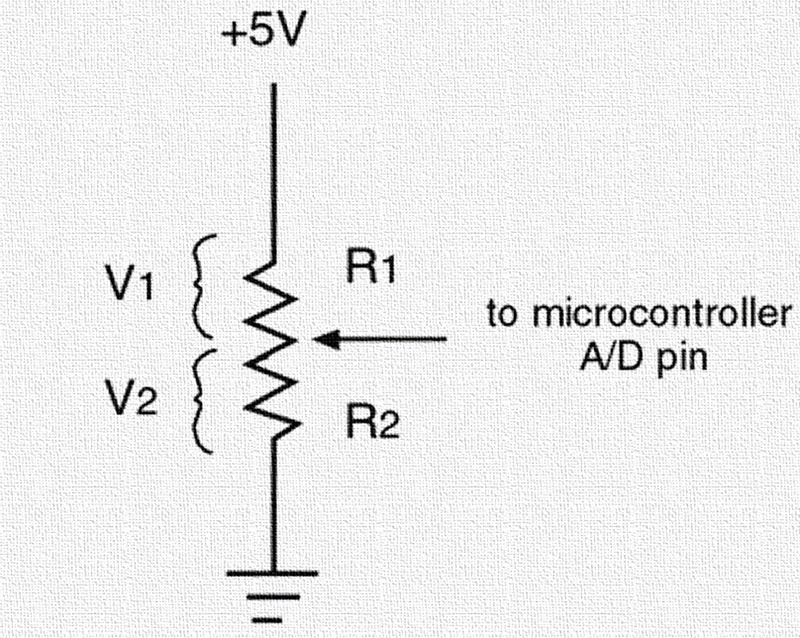
Figure 6. Potentiometers can be configured as variable voltage dividers with the amount of shaft rotation setting the division ratio. In this case, the five volts supplying the potentiometer is divided into two portions, V1 and V2, with V2 being the voltage presented to the Arduino’s analog input. When the potentiometer wiper is rotated to the ground position, V2 is zero volts, while when the potentiometer wiper is rotated to the five volt position, V2 is five volts. Typically, the five volt position is achieved with full clockwise rotation of the potentiometer.
With linear potentiometers, the resistance changes linearly with the degree of rotation; if you rotate it halfway, its resistance will be halfway between its minimum and maximum settings. While that arrangement is appropriate for applications such as controlling the position of a servo or the intensity of a light, for audio volume controls used in radios and MP3 players logarithmic potentiometers are often utilized.
For logarithmic potentiometers, for every 10% of wiper travel the signal volume is changed by (for instance) around 4 dB (https://e2e.ti.com/blogs_/archives/b/thesignal/archive/2012/10/22/logarithmic-potentiometers).
Interfacing a Light Dependent Resistor
Introduced earlier in the context of interfacing a potentiometer to a microcontroller, voltage dividers are often employed in interfacing resistive sensors (Figures 5 and 6). Let’s explore the use of a voltage divider arrangement for sensing light intensity using a light dependent resistor (LDR).
Also known as a photoresistor, an LDR is a light sensor which varies its resistance with the intensity of the ambient light. Typically, the LDR resistance decreases (conductance increases) with increasing light intensity.
As an example, the resistance of an LDR might have a daylight resistance of (say) 500 ohms with the resistance going up to (say) 200,000 ohms in total darkness. LDRs come in many types, with inexpensive cadmium sulfide units being commonly used in consumer products such as solar streetlamps, outdoor clocks, etc.
In a typical Arduino application, an LDR will be connected in series with a reference resistor (let’s call it R1) and supplied via a five volt source as shown in Figure 7.
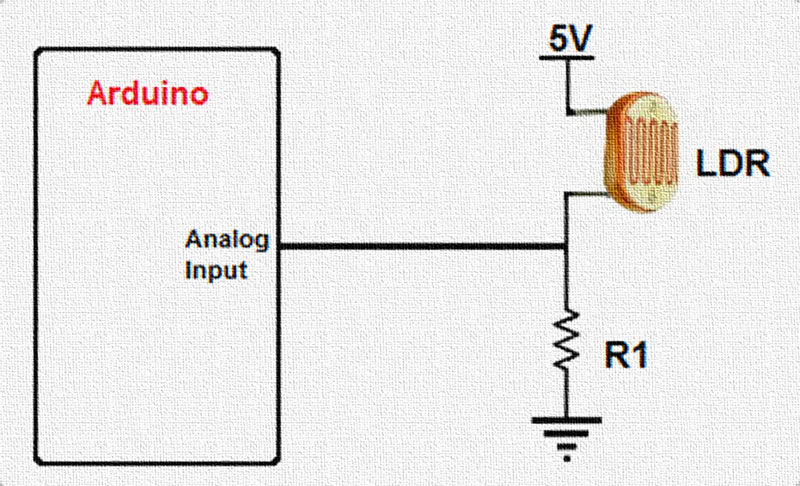
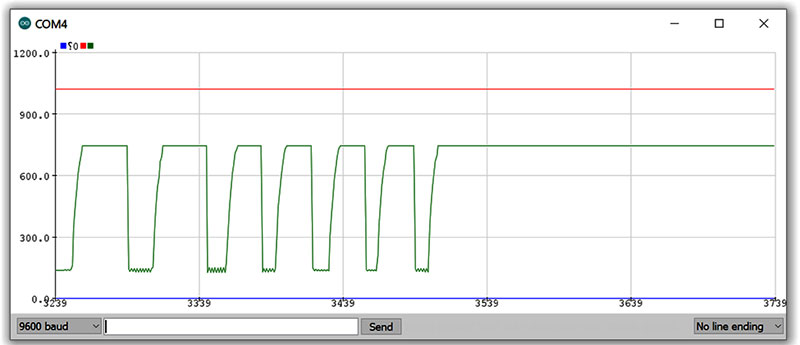
Figure 7. Light-dependent resistors (LDRs) are typically connected in series with a reference resistor (R1) and supplied via a volt source. The voltage present at the junction between the LDR and the reference resistor will then vary with the ambient light, with voltage increasing with light intensity (the LDR having low resistance) and with the voltage decreasing with increasing darkness. Unfortunately, the relationship between ambient light intensity and resistance is not a simple linear relationship. In this example, we’ve connected the pin A0 to a circuit which puts out a voltage in proportion to the light intensity detected by a LS06-S Ambient Light Sensor (Seeed Studio Grove - Light Sensor v1.2 - LS06-S). This sensor is based on a photo-sensitive transistor (phototransistor) whose resistance decreases when the intensity of light increases. Here, the green line corresponds to the detected light intensity when an illumination source is repeatedly turned on and off.
The voltage present at the junction between the LDR and the reference resistor will then vary with the ambient light with the junction voltage approaching five volts when the light is intense (the LDR having low resistance) and with the junction voltage approaching zero volts (ground) in the presence of darkness (the LDR having very high resistance). Sketch 2 presented later shows an Arduino sketch to plot light intensity using the Arduino plotter.
Technical Matters
Converting changes in resistance to changes in voltage is necessary in working with sensors which vary their electrical resistance with a physical property such as force, light intensity, temperature, or pressure. In such cases, resistance values must be mapped into voltage values that can be read by the Arduino ADC, which typically assigns a value of 0 to a zero voltage ADC input and a value of 1023 to an ADC input voltage of five volts.
The following considerations will be of interest to designers. First, many resistance-based transducers decrease their resistance (increase their conductance) with an increase in the physical property they are sensing. (This is the situation for many thermistors and light sensors.) In such cases, one may wish to utilize a circuit arrangement that increases the voltage delivered to the ADC as the sensor resistance decreases (conductance increases). Let’s call this a TYPE A circuit.
In the case of resistance-based transducers that increase their resistance (decrease their conductance) with an increase in the physical property they are sensing, one may wish to utilize a circuit arrangement that increases the voltage delivered to the ADC as the resistance increases (conductance decreases).
Let’s call this a TYPE B circuit. As an example of this, consider a strain gauge or load cell that utilizes an electrical element whose length increases and cross section decreases in response to increased tension; the result of which is that the resistance of the element increases.
Figure 5 shows how a voltage divider circuit consisting of two resistors in series and supplied by a voltage Vin (typically set to five volts in older Arduino systems) allows us to convert changes in sensor resistance to changes in voltage. In this arrangement, the output voltage (Vout) is connected to one of the Arduino analog inputs such as pin A0.
With this general arrangement, if R1 is the (variable) sensor resistance and R2 has a fixed value, then decreases in sensor resistance (increases in sensor conductance) will produce increases in the output voltage going to the Arduino ADC, meaning that this would be a TYPE A circuit. On the other hand, if R2 is the (variable) sensor resistance and R1 has a fixed value, then increases in sensor resistance (decreases in sensor conductance) will produce increases in the output voltage going to the Arduino ADC, meaning that this would be a TYPE B circuit.
Let’s now consider first the TYPE B arrangement where R2 is the (variable) sensor resistance. Suppose that under conditions of interest, R2 varies from a low value of R2min to a high value of R2max. When R2 is at a minimum, the voltage going to the ADC is then given by Vout = Vin (R2min / (R2min + R1)), while when R2 is at a maximum, the voltage going to the ADC is then Vout = Vin (R2max / (R2max + R1).
As an example, suppose Vin is five volts, R2min is 1000 ohms, R2max is 9000 ohms, and R1 is chosen to be 5000 ohms. When R2 is at a minimum, the voltage going to the ADC is then given by Vout = 5 (1000 / (1000 + 5000)) = 0.83 volts, while when R2 is at a maximum, the voltage going to the ADC is then Vout = 5 (9000 / ( 9000 + 5000) = 3.21 volts. The voltage span is then 3.21- 0.83 = 2.38 volts. This span is a little under half of the full allowable range of five volts that the Arduino ADC supports.
Can we do better than this? First, note that it may not always matter that the voltage span in question is only a fraction of the maximum allowable span. Although this span reduction effectively reduces the ADC resolution by one bit — making the effective ADC resolution nine bits rather than 10 — this may not present an issue in many practical instances.
This would be especially true if you were using an Arduino Due or similar microcontroller, supporting 12-bit resolution and returning values from analogRead() between 0 and 4095.
Note also that if we had chosen a different value for R1, we would get different results. For instance, if we had picked R1 to be 1000 ohms, then when R2 is at its minimum, the voltage going to the ADC would be given by Vout = 5 (1000 / (1000 + 1000)) = 2.5 volts, while when R2 is at a maximum, the voltage going to the ADC would be Vout = 5 (9000 / (9000 + 1000) = 4.5 volts. So, for R1 chosen to be 1000 ohms, the results get a bit worse for us (span reduced to 4.5 – 2.5 = 2 volts.)
What if we picked R1 to be 10,000 ohms? Then, when R2 is at a minimum, the voltage going to the ADC would be given by Vout = 5 (1000 / (1000 + 10,000)) = 0.45 volts, while when R2 is at a maximum, the voltage going to the ADC would be Vout = 5 (9000 / ( 9000 + 10,000) = 2.37 volts (span now to 2.37 – 0.45 = 1.92 volts.).
A bit of calculus can be used to show how the maximum voltage span occurs when R2 is set to be the square root of the product of Rmin and Rmax and is given by:
Vin [ (Rmax / (Rmax + R0) ) - (Rmin / (Rmin + R0) ) ]
where R0 is the square root of the product of Rmin and Rmax
To show this, differentiate the function [ (Rmax / (Rmax + R2) ) - (Rmin / (Rmin + R2) )] with respect to R2, set the derivative to zero, and solve for R2. (Confession: I gave up attempting this by hand and simply went online to https://www.derivative-calculator.net in order to get the needed result.) It turns out that in this case, the maximum voltage span occurs when R1 is 3000 ohms.
Then, when R2 is at a minimum, the voltage going to the ADC would be given by Vout = 5 (1000 / (1000 + 3000)) = 1.25 volts, while when R2 is at a maximum, the voltage going to the ADC would be Vout = 5 (9000 / (9000 + 3000) = 3.75 volts (the voltage span now being 3.75 – 1.25 = 2.5 volts).
Next, consider that we might want to have a “full range” circuit such that when R2=R2min, the ADC is presented with a zero-volt signal and when R2=R2max, the ADC is presented with a five volt signal.
This can be done using op-amps to process the sensor output by amplifying the output and adding an offset as needed. For the case where R1 is 3000 ohms and when R2 is at a minimum, we might want the voltage going to the ADC to be zero volts and not the 1.25 volts calculated above.
Similarly, we might want the voltage going to the ADC to be 5.0 volts and not 3.75 volts when R2 is at a maximum. That is, we might want to convert the original voltage divider output range of 1.25 volts to 3.75 volts to a new range of 0.0 to 5.0 volts.
This can be done using op-amps as follows: First, subtract 1.25 volts from the voltage divider output making the output range 0 to 2.5 volts using a differential amplifier circuit. Second, double the voltage of that signal with a second stage op-amp circuit featuring a gain 2.0.
Piezoelectric Transducers
One widespread form of voltage output sensor is the piezoelectric transducer, popular in large part because of their low cost. However, piezoelectric transducers require special considerations in their application because of their high output impedance.
By contrast, as an example, the popular LM35 temperature transducer with its low output impedance can be hooked up directly to a microcontroller ADC analog input without special circuitry. Simply put, the output from most piezoelectric sensors usually can’t be hooked up directly to a microcontroller analog input.
Instead, some form of signal conditioning is needed, which might be as simple as adding a high value resistor (e.g., 1 to 10 Mohms) across the transducer output, or might involve the use of an amplifier or buffer featuring a very high input impedance such as the use of a FET circuit.
Note that some manufacturers of piezoelectric sensors have signal conditioning built in by integrating a FET buffer into the sensors. This is also true for many electret microphones, which explains why many electret microphones require a low voltage power source.
Using Greeting Card Beepers as BioSensors
Although piezoelectric sensors are readily available on eBay and elsewhere (refer to Figure 8), it turns out that the ordinary piezoelectric transducers found in “singing” greeting cards can also be used to make a respiratory belt transducer [1] or a finger pulse sensor [2].
REFERENCES
[1] Bhaskar A, Subramani S, Ojha R. Respiratory belt transducer constructed using a singing greeting card beeper; Adv Physiol Educ. 2013 Mar;37(1):117-8. doi: 10.1152/advan.00166.2012. PMID: 23471261.
[2] Belusic G, Zupancic G. Singing greeting card beeper as a finger pulse sensor; Adv Physiol Educ. 2010 Jun;34(2):90-2. doi: 10.1152/advan.00015.2010. PMID: 20522903.
Piezoelectric devices (the prefix “piezo” is Greek for ‘press’ or ‘squeeze’) can be [1] sensors, which convert a physical property such as pressure into a voltage or current; [2] actuators, which convert an electrical signal into a physical displacement, for example to make a sound (e.g., buzzer, piezoelectric loudspeaker) or even to control a hydraulic valve; and [3] spark generators, for example, to produce a spark to ignite a flame.
Some piezoelectric devices are both sensors (supplying an electrical signal when deformed) as well as actuators (converting an electrical signal into a physical movement).
Sensors based on the piezoelectric effect are generally classified as piezoelectric (generating a voltage when deformed) or piezoresistive (changing resistance when deformed).
Piezoelectric sensors such as that shown in Figure 8 have a very high output impedance and are most easily modelled as a voltage source in series with a capacitor (Figure 9) or as a charge source in parallel with a capacitor.
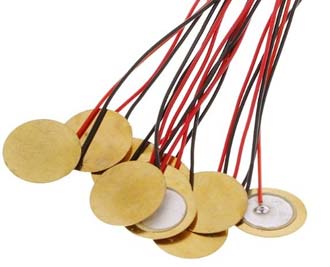
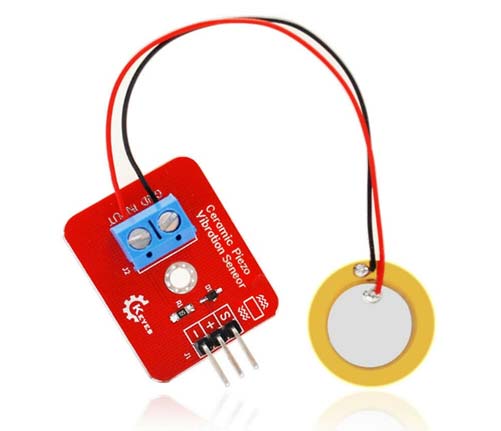
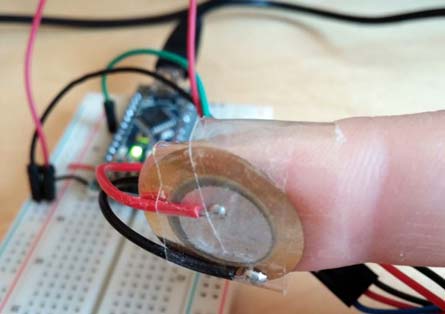
Figure 8. Piezoelectric devices such as these can serve as both a pressure sensor and as an actuator (sound source). They are about 1.5 cm in diameter and are available on eBay in lots of 10 for under $10, including shipping. To use the device as a pulse sensor, tape the unit circumferentially to a finger as shown. For details, please consult the following report: Belusic G, Zupancic G. Singing greeting card beeper as a finger pulse sensor; Adv Physiol Educ. 2010 Jun;34(2):90-2. doi: 10.1152/advan.00015.2010. PMID: 20522903. Both raw devices and modules incorporating signal conditioning circuitry for easy interfacing are available.
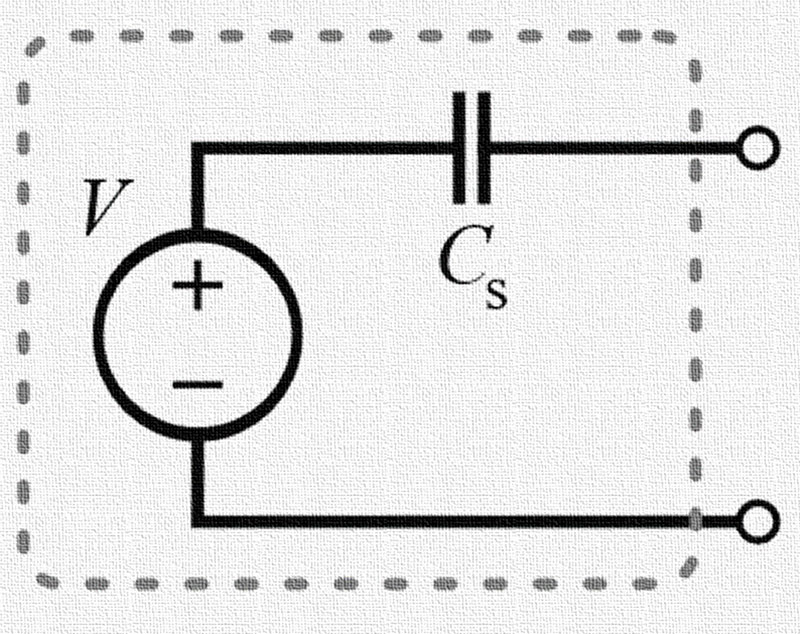
Figure 9. Piezoelectric sensors have a very high output impedance and are commonly modeled as a voltage source in series with a capacitor. This means that special circuitry must usually be employed to faithfully connect the signal to a measurement source. The capacitance of a typical piezoelectric device is in the range of 500 pF to 1000 pF. For details, see http://www.sensorwiki.org/doku.php and https://ccrma.stanford.edu/wiki/Sensors.
Consequently, as already noted, outputs from piezoelectric sensors typically require some signal conditioning before being fed to an oscilloscope or to an ADC (Figure 10).
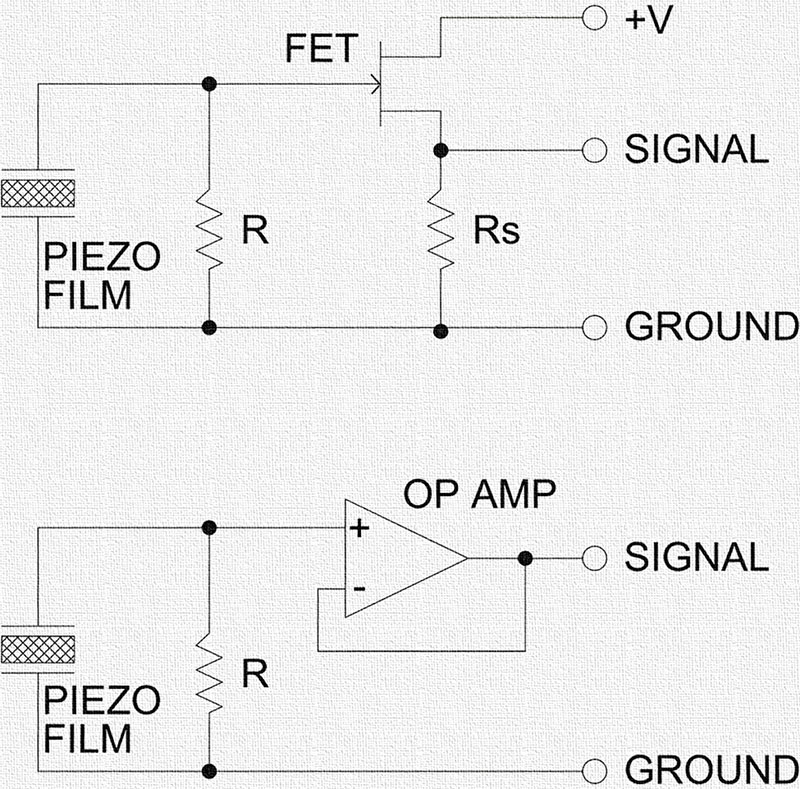
Figure 10. Piezoelectric sensors are commonly buffered by circuits using a JFET transistor or high impedance op-amp before further processing or being fed to an ADC. The resistor R determines the input impedance of the circuit. The value of Rs in the JFET circuit is not critical and typically may be any value from 3.3K to 10K without much change in the waveform. This configuration has minimal parts but is limited in that if the input voltage exceeds the JFET gate-source forward voltage plus the bias voltage at the source, the signal will be clipped. The design may be improved by connecting the gate resistor to a bias voltage instead of to ground. This allows the gate voltage to set the bias at the source to a higher value which increases the headroom and allows a large signal input before clipping.
That is, to process the raw signal using standard measuring equipment, the signal needs to be transformed into a low impedance voltage signal. Charge amplifiers are sometimes used for this purpose, in which the charge output from the device is converted into a voltage. More commonly, less complex circuitry is employed based on JFET transistors or op-amps such as that shown in Figure 11.
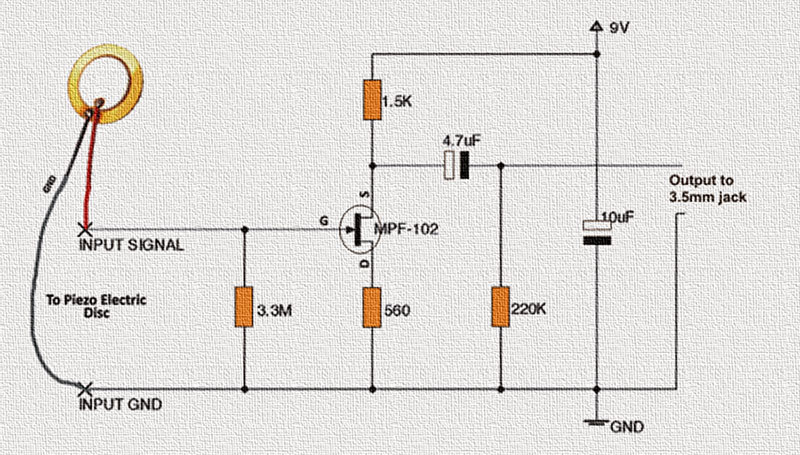
Figure 11. Sample interface circuit for a piezoelectric sensor. The MPF-102 is a popular N-channel JFET transistor commonly used with piezoelectric devices. The circuit shown illustrates the MPF-102 used in a piezoelectric contact microphone/guitar pickup application. A detailed description of the circuit operation is available at https://makingcircuits.com/blog/diy-contact-mic-circuit/.
Figure 12 provides information on the MPF-102 JFET transistor, which is commonly used with piezoelectric sensors. For additional information on the art and science of interfacing piezoelectric devices to JFET transistors, visit http://www.muzique.com/lab/buffers.htm.
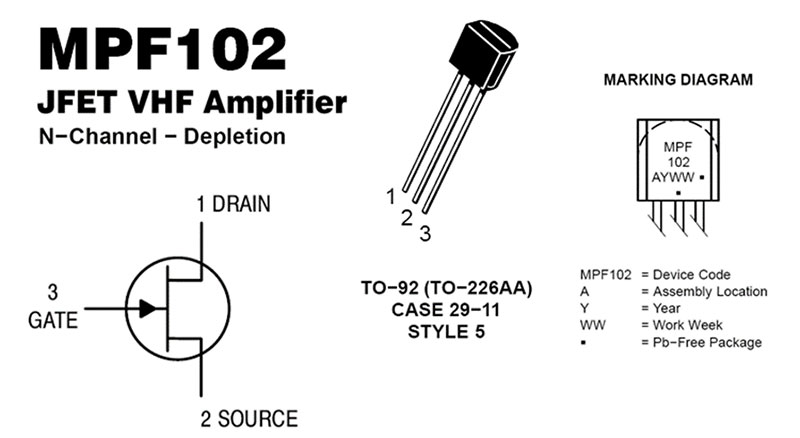
Figure 12. The MPF102 is a JFET field-effect transistor with a very high input impedance, making it useful in interfacing with high impedance piezoelectric sensors.
Photoplethysmographic Sensors
Photoplethysmography (PPG) is a noninvasive optical technique that can be used to readily detect an individual’s heartbeat through illumination/reflection of the microvascular bed of tissue, typically in a finger, toe, or earlobe (Figures 13 to 16).
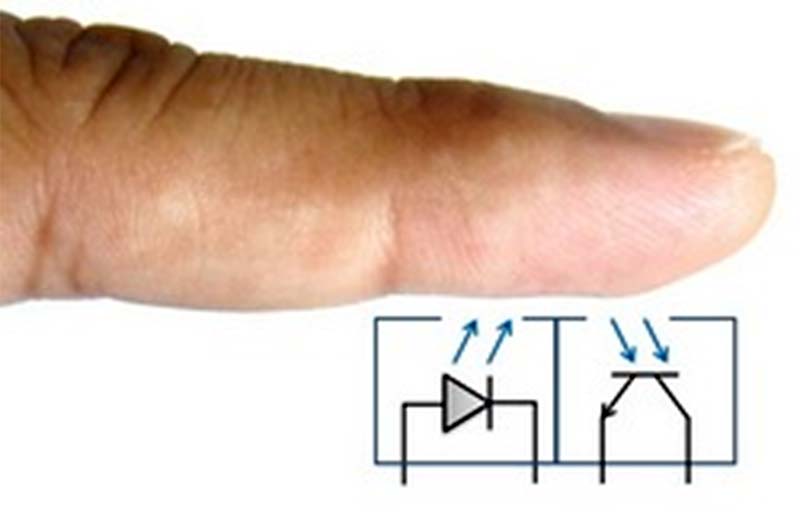
Figure 13. Conceptual arrangement of a photoplethysmograph front-end. An LED emits a light — typically with a wavelength of 600–700 nm — into the microvascular bed of a finger, toe, or earlobe. The reflected light is detected by a phototransistor to produce a small pulsatile signal on top of a large DC component. Another arrangement is to place the LED and phototransistor on opposite sides of the finger, with variations in transmitted light being detected by the phototransistor.
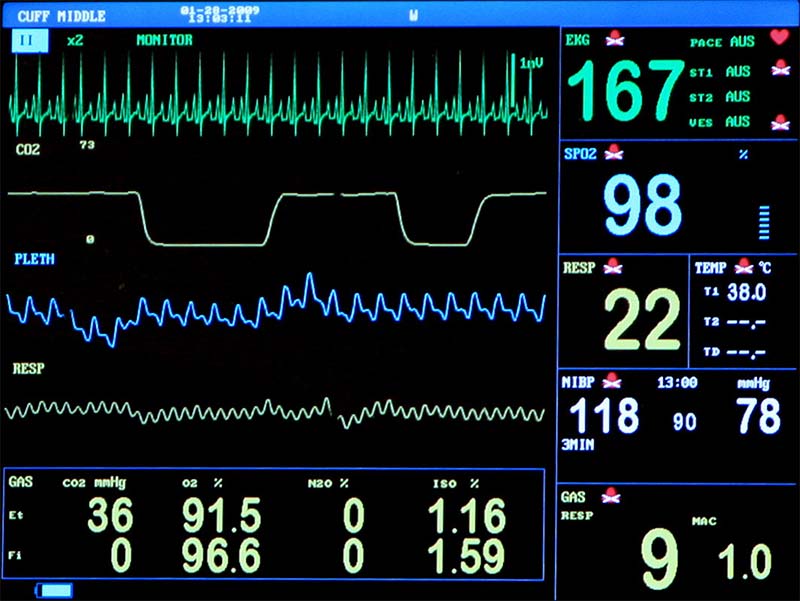
Figure 14. A photoplethysmograph tracing (colored blue in this image) is often included as part of a patient monitor such as those used in an operating room or ICU. The patient’s electrocardiogram (ECG; shown in green) shows extreme tachycardia with a heart rate of 167 beats per minute. Below the ECG tracing (in yellow) is the patient’s capnogram signal, showing the real time value of the carbon dioxide concentration in the patient’s airway.
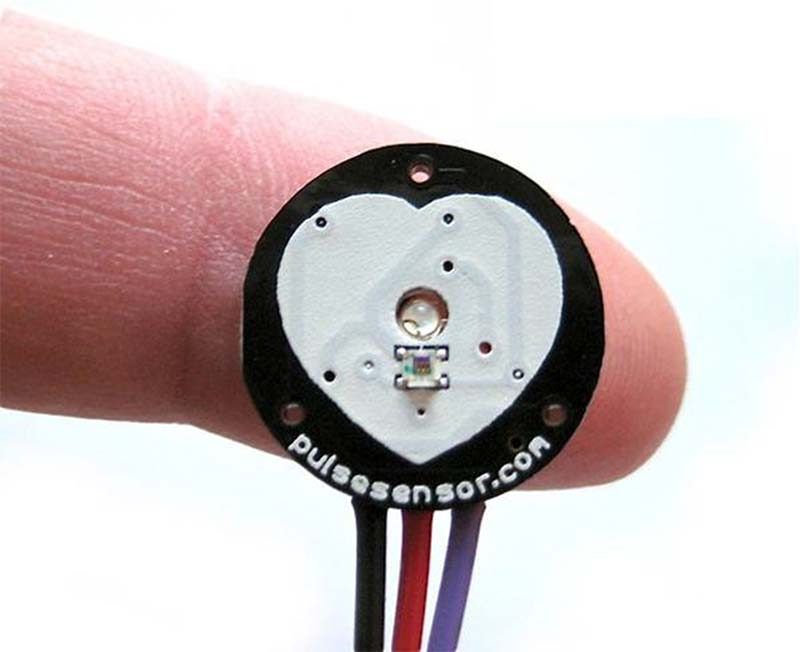
Figure 15. An easy-to-use open source photoplethysmographic (PPG) pulse sensor is available from pulsesensor.com. This website also provides a full schematic diagram and other useful information, such as how to hook up the device to an Arduino microcontroller. The unit has three connections: power (five volts); (high level) analog signal output; and ground.
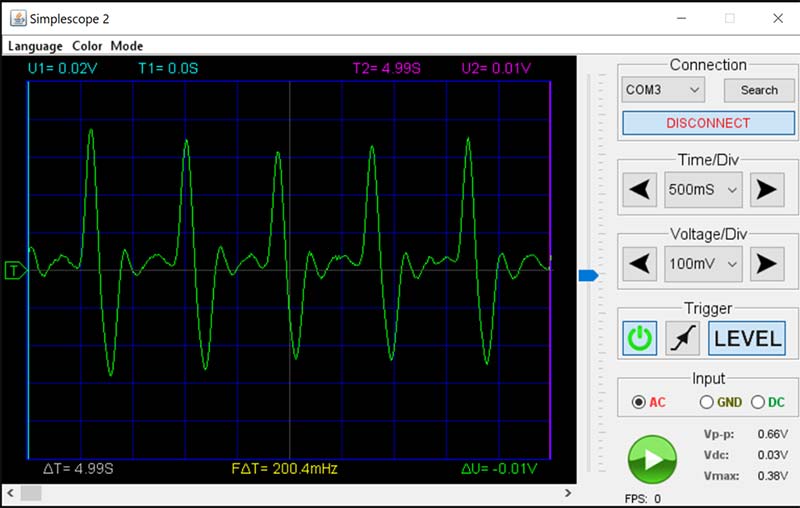
Figure 16. A sample recording obtained using the PPG pulse sensor shown in Figure 15, displayed using an inexpensive single-channel USB oscilloscope. The time span for the recording is five seconds, while the peak-to-peak signal amplitude is 660 millivolts. Note that with this software, you can also position the blue and violet vertical reference lines with respect to various signal components (e.g., signal peaks) to precisely measure time intervals of interest.
Photoplethysmography has as its primary use the determination of heart rate, but can also be helpful in detecting some forms of cardiac arrhythmias as well as in determining pulse arrival time (time from the start of the ECG QRS complex to the arrival of the PPG pulse).
Additionally, systolic blood pressure can be determined by noting the cuff pressure that extinguishes the PPG signal. Research applications of photoplethysmography include extraction of respiratory rate information from the PPG and detecting hypovolemia (low blood volume) by examining the periodic variability of the PPG signal amplitude. While it’s entirely possible to build your own photoplethysmography sensor, the easiest way to get started in photoplethysmography is to buy a photoplethysmography sensor online, such as the unit available at pulsesensor.com and simply connect the unit to a microcontroller; the signal output going to any analog input pin you choose.
The unit available at pulsesensor.com is more advanced than more basic models in that the unit incorporates a high-pass filter stage and a subsequent amplifier stage as well as a voltage-offset circuit to make the signal going to the microcontroller analog input ready for use without further signal processing.
If, on the other hand, you wanted to build a PPG from scratch, you’d be forced with the reality that the signal output from the phototransistor would consist of a small pulse signal on top of a large DC value (typically in the range of two volts when using a five volt supply). Thus, to obtain a strong pulse signal, it’s necessary to AC couple (high-pass filter) the signal from the phototransistor and then amplify the signal to bring it into a range suitable for digital processing.
However, as the processed signal is bipolar in nature (i.e., having both positive and negative excursions) while Arduino analog inputs are restricted to the range of 0 to 5 volts (0 to 3.3 volts in some models), the signal must be “level-shifted” by 2.5 volts (1.65 volts). Since the device from pulsesensor.com does all of this, one can understand the enormous convenience of buying rather than building.
Conclusion
This article has provided basic information about the various types of electronic sensors commonly used with microcontrollers. Three types of analog sensors were discussed: [1] those that change their output voltage with changes in a physical property like angular position, temperature, pressure, or light intensity; [2] those that change their resistance with changes in a physical property; and [3] piezoelectric sensors. Some sample Arduino sketches have been provided as well. NV
Low Output Impedance Devices
- Potentiometer used in voltage divider mode.
- Linear temperature sensors (e.g., LM34, LM35, TMP36).
- Hall effect magnetic field sensor with analog output.
- Pressure sensor modules with analog output.
- Accelerometer modules with analog output(s).
- Photoplethysmograph (PPG) module.
- Acoustic sensor (microphone) module.
- Electrocardiogram (ECG) amplifier module.
- Outputs from operational amplifiers and instrumentation amplifiers.
High Output Impedance Devices
- Piezoelectric vibration sensors (e.g., contact microphones).
- Piezoelectric force sensors.
- Piezoelectric accelerometer.
Table 1. Types of Voltage-Output Sensors.
A considerable number of sensors produce a voltage output that varies in response to a change in a physical parameter such as temperature or pressure. Those devices with low output impedance can usually be connected directly to an ADC, although some applications may require signal processing to amplify and/or shift the signal to make use of an ADC that can’t handle negative-going inputs. However, those devices with a high output impedance (these are often piezoelectric products) will generally require signal conditioning before being connected to an ADC, oscilloscope, or other measurement device.
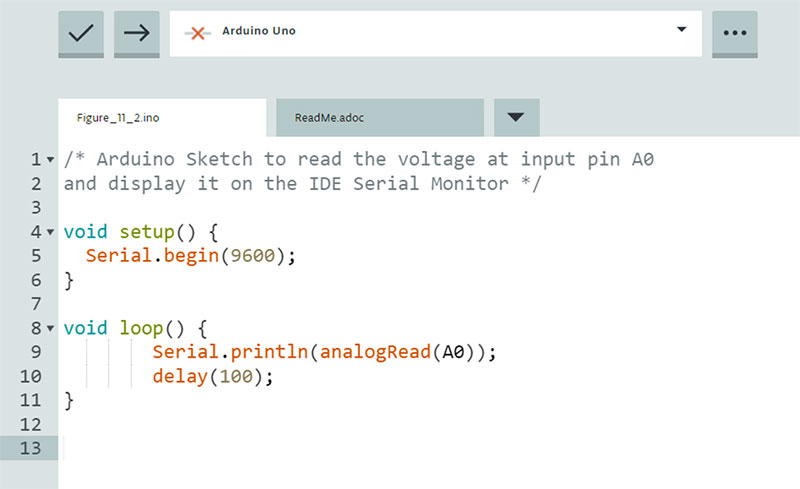
Sketch 1. An Arduino sketch to read the voltage at Arduino input pin A0 when connected to the wiper of a potentiometer configured as a voltage divider.
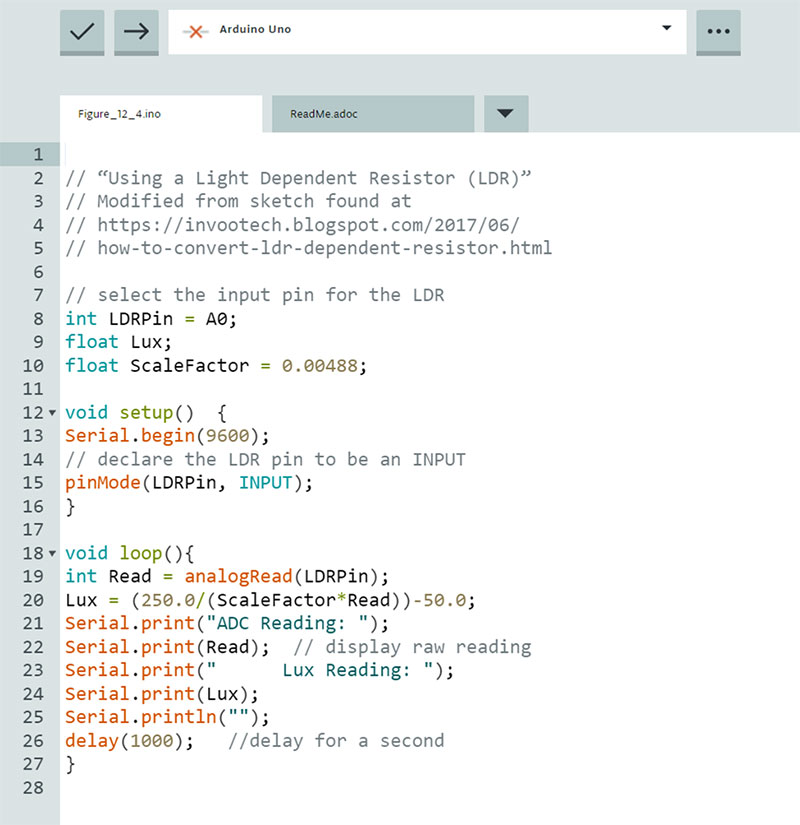
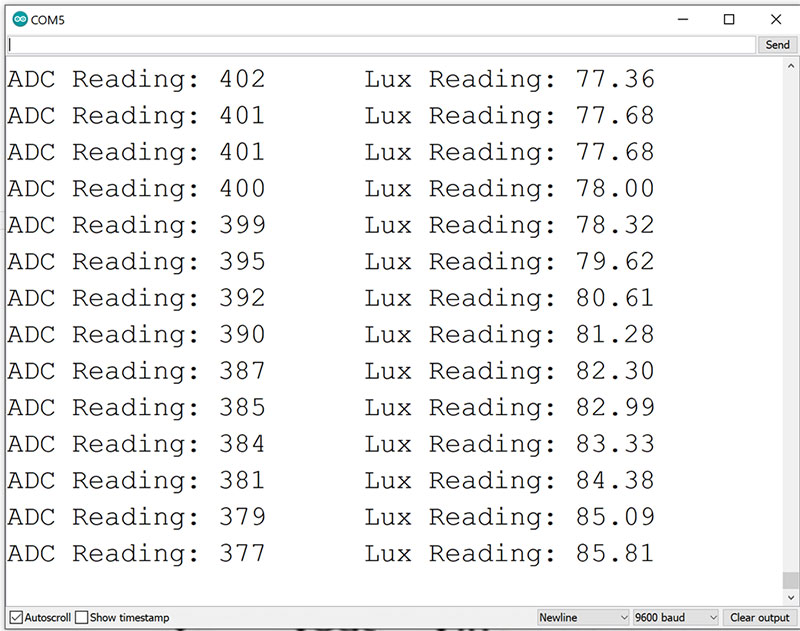
Sketch 2. An Arduino sketch to display light intensity using the Arduino serial monitor. TOP: The sketch details. BOTTOM: Output from the Arduino serial monitor.
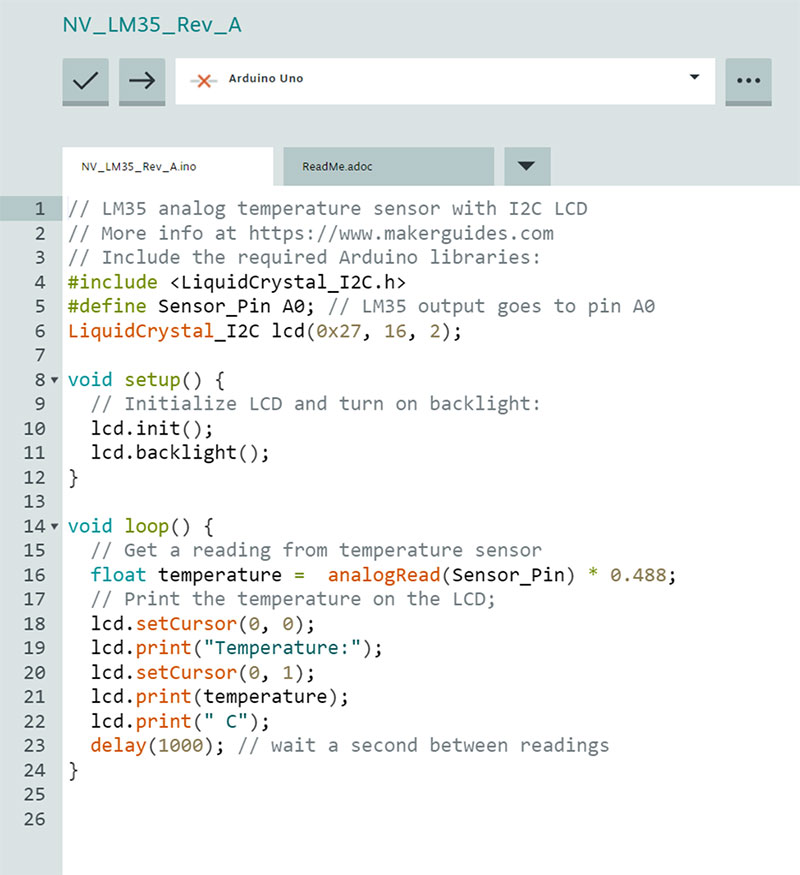
Sketch 3. An Arduino sketch to display temperature on an I2C 1602 type LCD display using the LM35 temperature sensor chip.