When I was in junior college, I did an experiment in a physics class that I have never forgotten. It was the classic falling body experiment to measure the acceleration of gravity; 9.81 meters/sec2. I loved carefully adjusting the apparatus and meticulously taking the data, trying to get a result that was as close as possible to the established value. Frankly, I don’t recall how close I got, but it was the thrill of scientific inquiry that grabbed me.
THE GOAL
Now, in this age of computer technology, I thought it might be challenging and fun to see how good I could do in my garage with a fairly simple DIY apparatus. Figure 1 shows the tower I built to drop a 3/4” steel ball down an evacuated pipe, past four photogates.
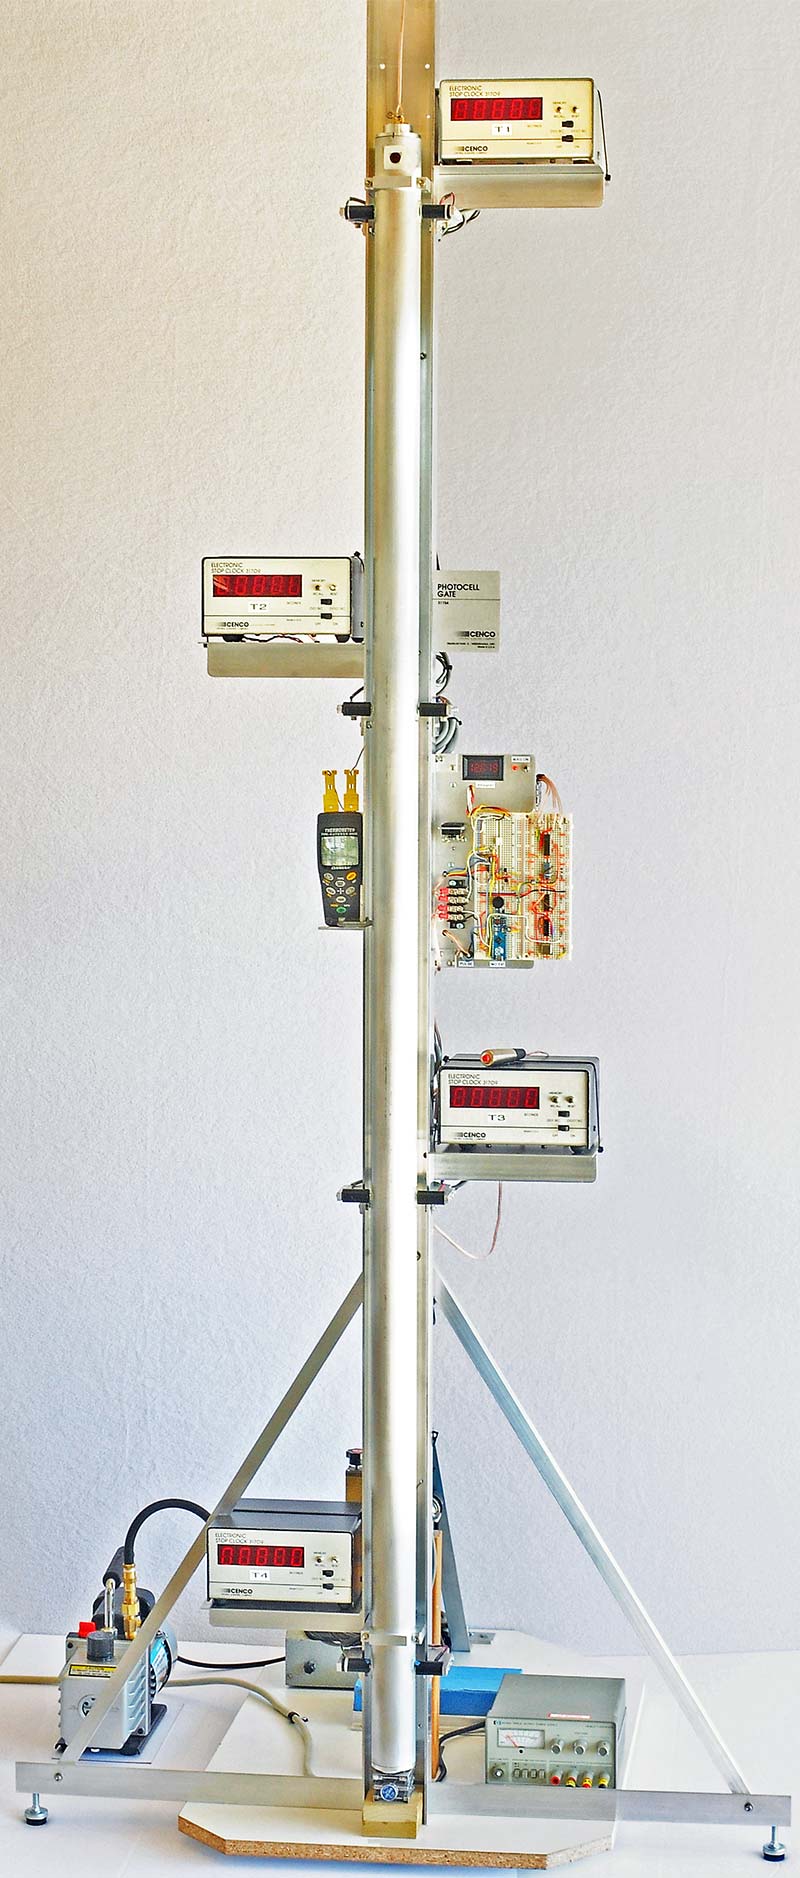
FIGURE 1. The 72””Tall evacuated drop tower has four photogates and timers. The steel ball takes about 600 milliseconds to drop.
In operation, the four timers simultaneously start when the ball is released at the top and stop in sequence as it passes each photogate.
By knowing how far apart the gates are and how long it takes to traverse between them, the acceleration of gravity can be calculated. The big question is how accurate would it be?
Spoiler alert: The final results knocked my socks off!
EBAY COMES TO THE RESCUE, SORTA?
When I first started this project, I was planning on building the photogates and timers from scratch; possibly even using a microcontroller to tie it all together. The photogates would consist of an LED on one side and a photodiode on the other. The falling ball would block the beam and stop the associated timer. An Arduino could probably handle the timing and digital display functions.
However, one morning as I was searching eBay, some guy was selling surplus educational Cenco photogates and timers ready to go for only $34 each (see Figure 2).
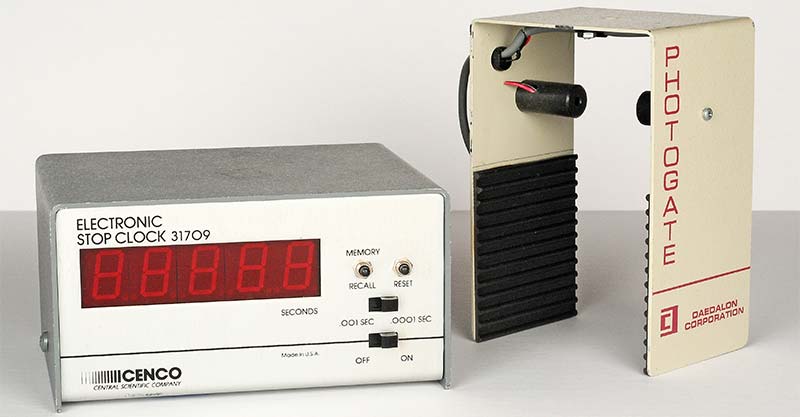
FIGURE 2. Cenco produced photogates and timers for the educational market. I bought four sets on eBay for $34 each.
They were originally used in schools to measure the very thing I was doing. So, I bought four of them in the hope that they would save me a bunch of time and effort. Three timers were enough to do the job, but four would allow averaging. Little did I know how much tweaking they would require to meet my expectations. Nothing is ever easy!
DESIGNING THE TOWER
I decided to make the tower as tall as practical, so the timers would have a large count and maximize the data resolution. Referring back to Figure 1, I designed the tower as a two-part structure. The “backbone” of the structure was a 3” x 1.5” x 84” long U-shaped piece of 1/8” thick aluminum. It was easy to mount the timers and photogates on its flat surfaces.
The backbone was mounted on an MDF wood base with diagonal braces to stabilize it. Three adjustable feet allowed me to make it perfectly level, so the ball would drop exactly down the center of the evacuated pipe.
The second part of the structure was a hollow 2” diameter aluminum pipe for the vacuum. It was 72” long and connected to the backbone near the top and bottom.
The four photogates were mounted along the backbone at exactly 21.500” ±0.010” intervals. Also included was a breadboard because I knew that sooner or later, I’d probably be adding something or other. An Arduino Micro was used to control the electromagnet and generate the start pulses for the timers.
DESIGNING THE EVACUATED PIPE
At the top of the pipe was an electromagnet (Figure 3) which held the ball while the pipe was being evacuated to a reasonable level; i.e., less than 100 microns; 100 microns would leave about one part in 10,000 of air. Notice the thin black O-ring that sealed the cover to the top edge of the 2” pipe.
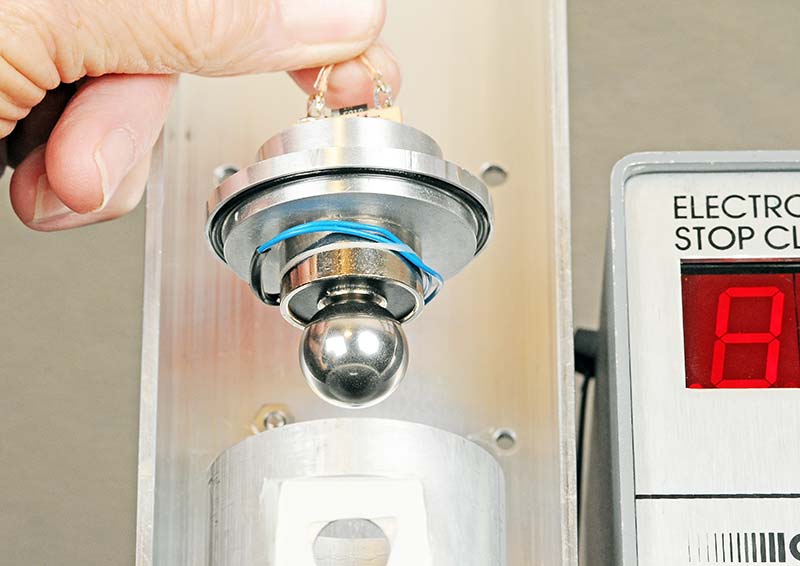
FIGURE 3. An electromagnet holds the 3/4” steel ball at the top while the 2” pipe is evacuated. When the ball is released, the four timers are simultaneously started.
Figure 4 is a close-up of the windows for the photogate beams. I fabricated them from small pieces of microscope slides and sealed them with Hysol 1C epoxy. Amazon sells a 4 oz kit of 1C under the name Loctite.
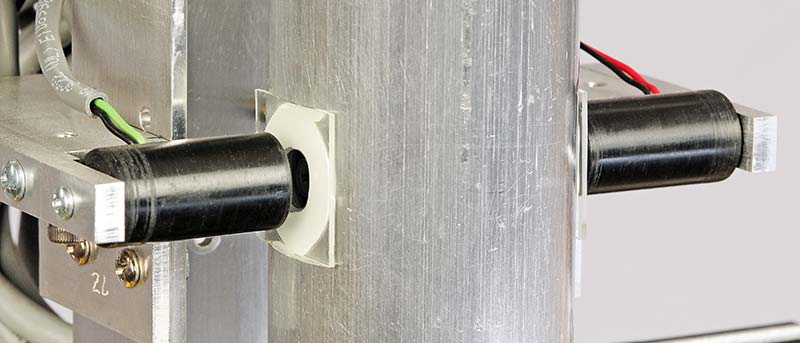
FIGURE 4. Sealed glass windows allow the beam to pass from one side of the pipe to the other. The falling ball blocks the beams and stops the counters.
The infrared LEDs and photodiodes that Cenco used were a small size and loosely inserted inside their black cylindrical plastic housings (see Figure 5). I wasn’t happy with this arrangement, so I fabricated and installed small aluminum inserts to improve the alignment and reduce the beam aperture to 0.050”. Much better!
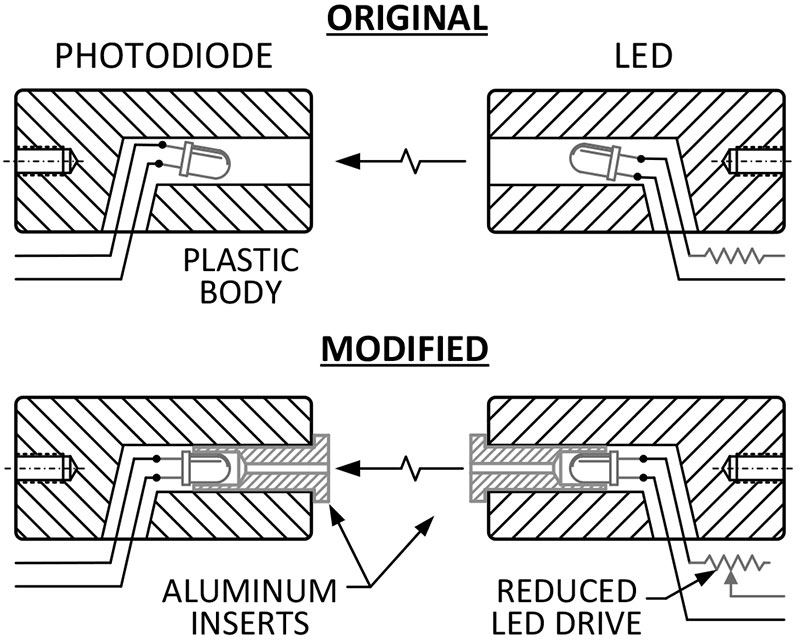
FIGURE 5. Small inserts with 0.050” holes were retroFItted to the photogates to improve alignment and reduce the beam size.
Located at the bottom of the pipe (Figure 6) was the “collection cup.” It was partially filled with small lead shot to cushion the ball’s sudden stop. Notice that the cup also has an O-ring to seal it to the bottom surface of the pipe.
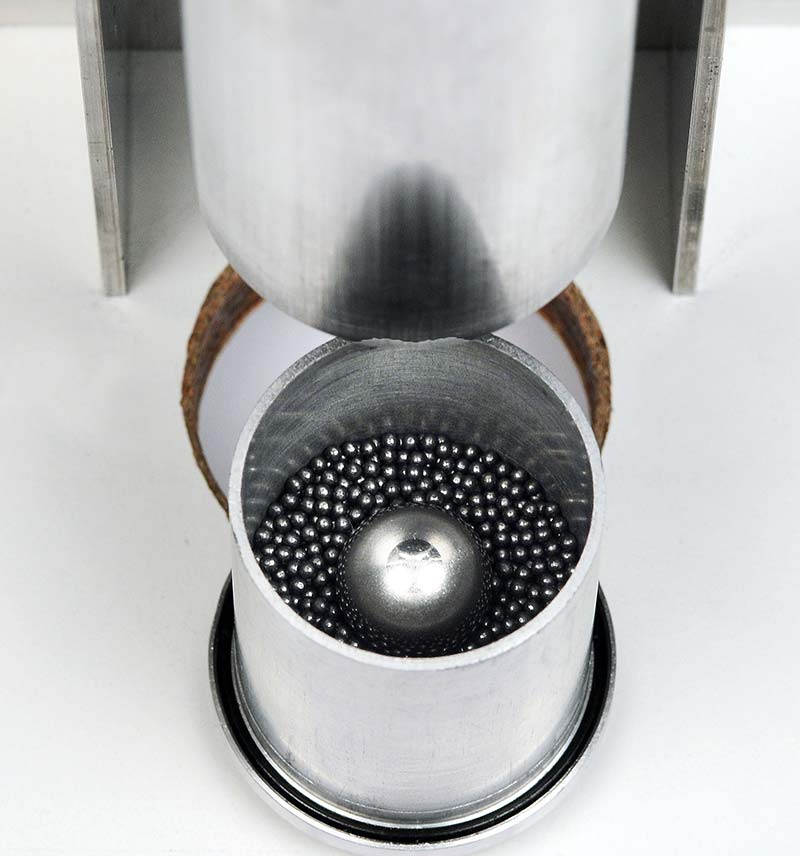
FIGURE 6. The sealed cup at the bottom contains tiny lead shot which cushions the falling ball. The FInal velocity of the ball is about 5.99 m/sec (13.4 mph).
The whole structure was precisely leveled by dropping a plumb bob on a string down the exact center of the vacuum pipe and adjusting the leveling feet.
THE VACUUM SYSTEM
The vacuum system uses a 2.5 CFM pump from Harbor Freight that was normally used to service refrigerant systems; refer to Figure 7. The specs said it would go down to 80 microns and by golly it did! That was more than sufficient because any remaining drag would have a negligible effect.
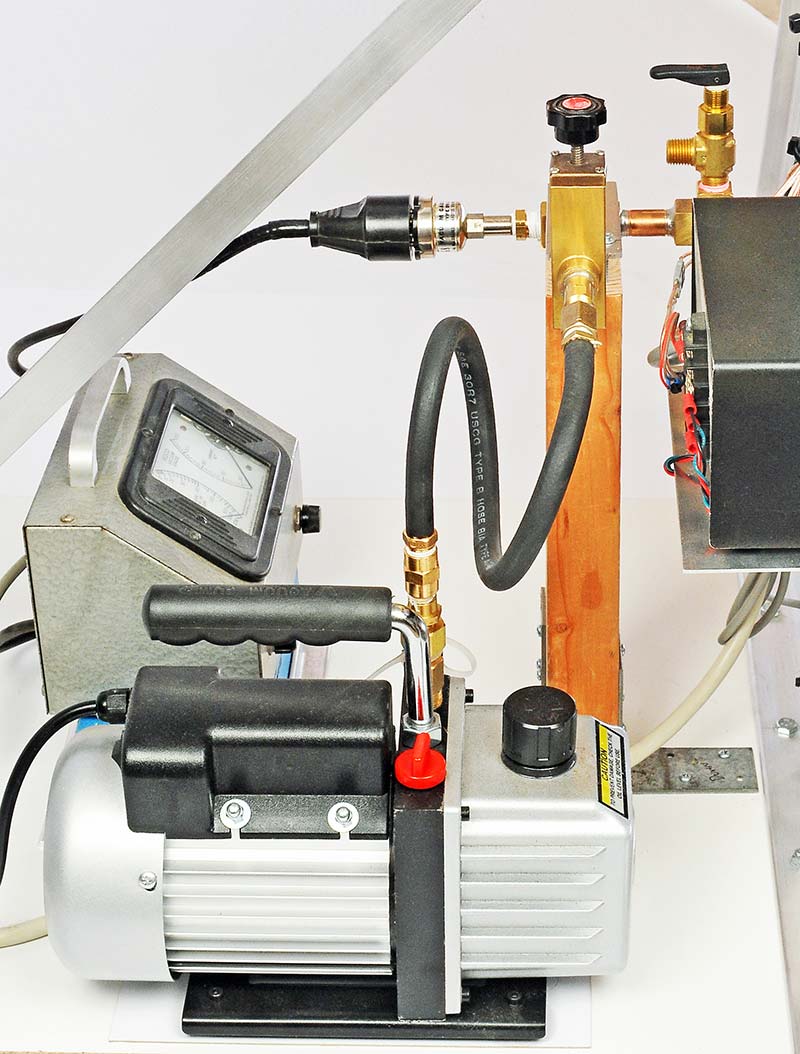
FIGURE 7. The vacuum pumping system uses a 2.5 CFM pump from Harbor Freight to pump the air out of the sealed pipe. The vacuum is typically <100 microns.
On eBay, I found a vintage Veeco vacuum gauge and thermocouple sensor to go with it. Of course, I could have used one of the new digital vacuum gauges, but I love the old stuff. I also found a very nice Veeco bellows shutoff valve to isolate the pipe just before doing a drop.
MEASURING THE DISTANCES BETWEEN THE PHOTODIODES
Accurately measuring the distances between the photodiodes was the trickiest and most critical part of the whole experiment. To get the accuracy I wanted, I purchased an NIST certified 24” precision ruler from McMaster for $134. Gulp. It was calibrated to +-0.0001”.
Figure 8 illustrates how I used the 24” certified ruler to calibrate four small ruler segments mounted on a 72” aluminum “transfer ruler.”
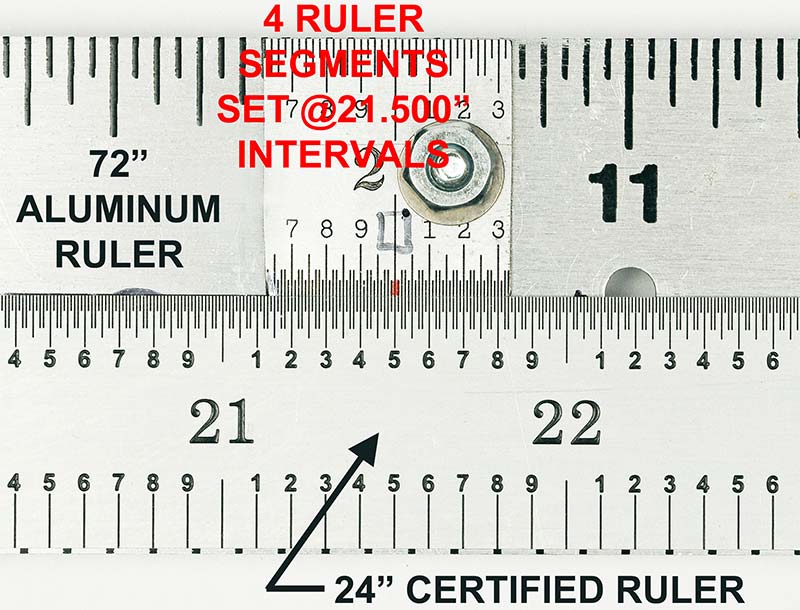
FIGURE 8. To measure the distance between photogates, a 24” certiFied ruler was used to position four ruler segments at precise 21.500” intervals on a 72” aluminum ruler.
Figure 9 shows the tower tilted over backwards, with the transfer ruler ready to be inserted into the pipe.
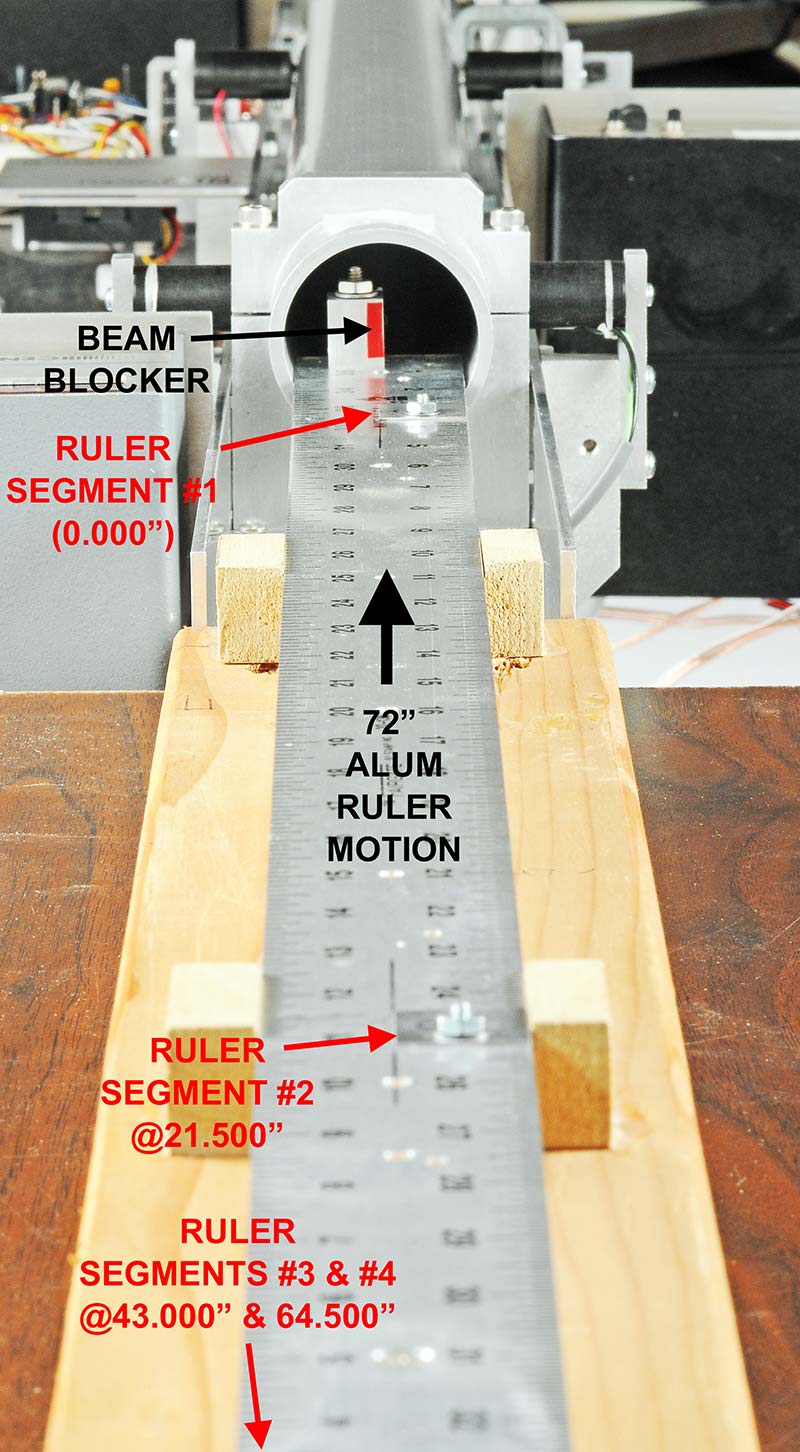
FIGURE 9. The aluminum ruler was slowly slid into the tilted-down vacuum pipe until each beam was blocked and its position noted within ±0.001”.
The ruler was slowly slid in until it blocked the beams one at a time. Using a microscope, the precise reading (+-0.001”) of the respective ruler segment was noted each time a beam was blocked. The final distances were:
@80 degrees F
D1 (T1 to T2) = 21.512” +-0.001”
D2 (T2 to T3) = 21.519” +-0.001”
D3 (T3 to T4) = 21.501” +-0.001”
I was also concerned about the thermal expansion coefficient of the aluminum backbone, which was 12 x 10-6 per degree F. This parameter was important because the photogates were connected to the backbone, and any change in its length would affect the calculations. So, I taped two thermocouples along the tower. During testing, the ambient temperature varied from 78 to 83 degrees which produced a length change of 0.004”. This doesn’t sound like much but it counted.
THE FUN PART: TAKING DATA
A typical test went as follows:
- Reset the timers.
- Turn on the electromagnet.
- Lift up the magnet and insert the steel ball.
- Replace the magnet and pump down the pipe for about five minutes.
- Turn off the magnet.
- Listen as the ball falls into the cup with a clunk.
- The ball accelerates to about 6 m/sec (~13 mph) by the time it reaches the bottom in 611 ms.
- Read the values of the four timers and type them into the computer.
- Note the calculated result and see how close it is to the expected value.
What went right:
- There were no leaks in the vacuum system.
- The timers started and stopped perfectly.
- I plugged the numbers into the computer, and it calculated the acceleration of gravity. History was being made!
What went wrong:
- After doing a dozen drops, the calculated values were way off — 2.5% low. What a disappointment!
- The answer was supposed to be 9.806 m/sec2. I got an average of 9.564 m/sec2.
- What the heck was wrong?
NOW COMES THE 99% PERSPIRATION PART: SOLVING ALL THE PROBLEMS
Before starting this project, I found several examples on the Internet of how other Physics classes conducted similar experiments.
However, I like to do things my own way first as a challenge, then refer to the published knowledge if I bog down. I think of it as a learning process and if something doesn’t work quite right, I enjoy trying to solve the problems myself.
Problem: My initial results were 2.5% low. They should have been 9.806 m/sec2, or so I thought.
The Obvious: Gravity is not the same all over the Earth. You need to factor in the local altitude and the latitude. I had accounted for altitude but had completely left out a term for latitude.
Fact: People at the equator tend to be spun off the Earth. If a person at the North Pole weighs 100 pounds, they would weigh approximately 1/2 pound less at the equator.
Solution: The Internet had a plethora of sites that calculated the “theoretical” value for any location on Earth. The corrected value for my location was 9.7941 m/sec2. (@2965’ altitude and 34.5° latitude).
Result: My experimental values were much closer now, but still about 1/2% low and they varied by ±1%. What else should I look at?
Possible Problem: The maximum clock speed of the Cenco timers was 10 kHz.
Analysis: A quick analysis showed that a faster clock would vastly reduce the variation.
Solution: Open the Cenco timers up and connect them to an external 100 kHz clock.
Result: Much improved, but it still could be better.
Final solution: I added a master 1.0000 MHz oscillator that fed all four timers; refer to Figure 10.
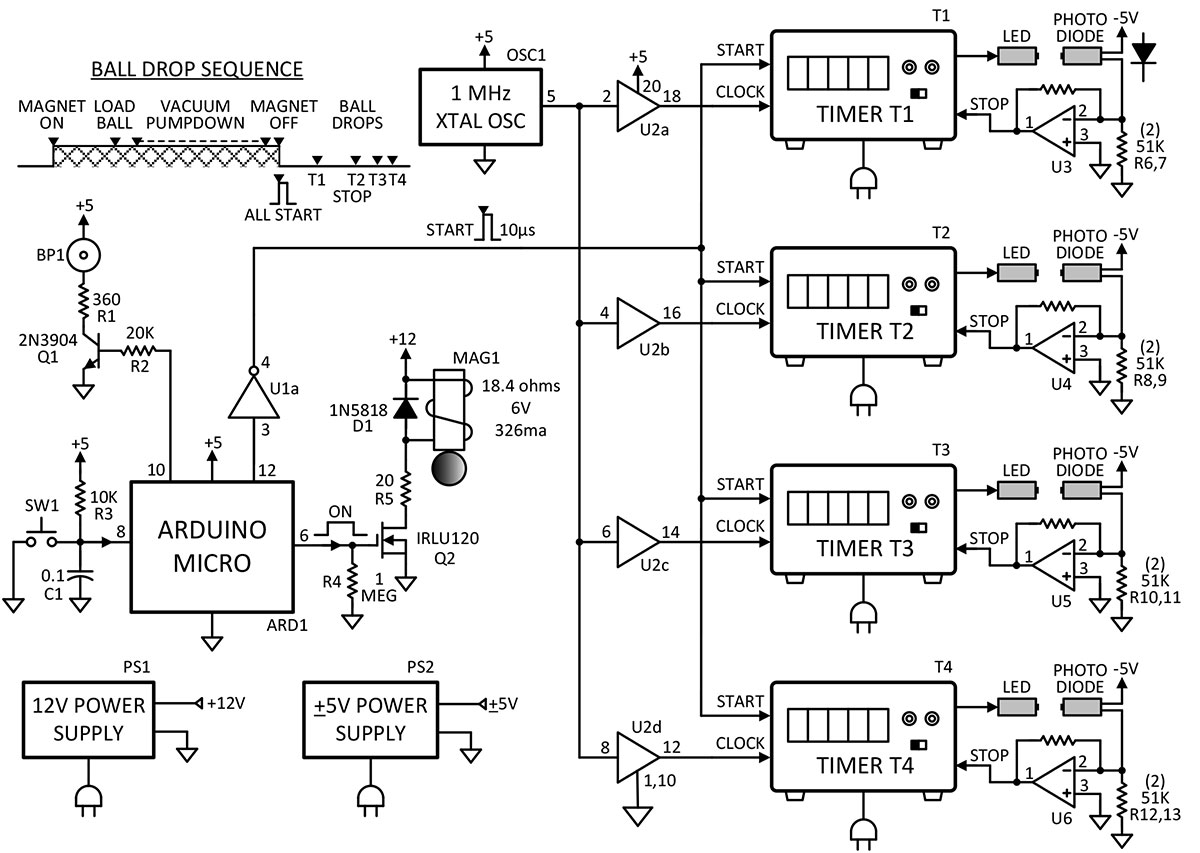
FIGURE 10. The 1 MHz clock fed all the timers. RetroFitted op-amps improved the performance of the photodiodes by using them in the photoconductive mode.
New Problem: There were only five digits on the timers. I needed six digits for the new 1 MHz clock.
Solution: Just let the extra digit roll over. From previous testing, I already knew what the value of the rolled-over digit would be. I double-checked the Cenco timers with a separate six-digit counter. Right on the button.
Problem: The Cenco photodiodes were slow to respond when a beam was blocked.
Reason: A look at the Cenco circuitry revealed the photodiodes were operating in the photovoltaic mode.
Solution: Change the circuit to the photoconductive mode, which is much faster.
Complication: The photoconductive mode required a negative bias on the photodiodes, so I had to add new external op-amps and a -5V supply as seen in Figure 10.
Last Problem: The Cenco LEDs were overdriven (23 mA), causing the photodiodes to saturate which slowed the recovery time down by 100s of microseconds.
Solution: Put a little trimmer in series with each LED and lower the current to around 3 ma.
Confirmation Technique: Modulate the LEDs at 1 kHz and note the response of the photodiodes on the scope.
Result: I adjusted the LED drives, so all the photodiode recovery times were equal to 10 µs. This resulted in a huge improvement in data variation.
In Hindsight: If I had just built the photogates and timers from scratch instead of buying the Cenco units, I would have anticipated and designed-out many of the problems I encountered. Unfortunately, I was blinded by my original idea that I could simply take a bunch of old discarded educational units and make them sing. Luckily, it all worked out.
THE BIG FINALE!
Success times two! I could hardly believe how close the experimental results were to the expected number. Check out Figure 11 for a typical series of 10 ball drops. Notice that the average is only off by +.0004. Not too shabby!
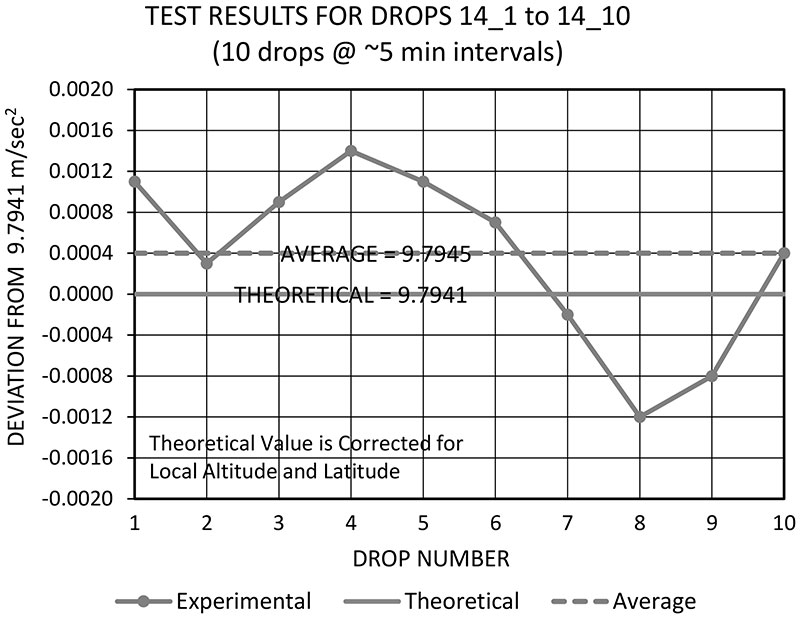
FIGURE 11. After making numerous improvements to the apparatus, a plot of 10 drop tests showed very small errors. The results more than met my expectations!
Figure 12 shows how the data from one of the drops was reduced. Over the next several days, I took many runs and they were all very similar. The results were so consistent that I was at a loss as to what else could be improved.
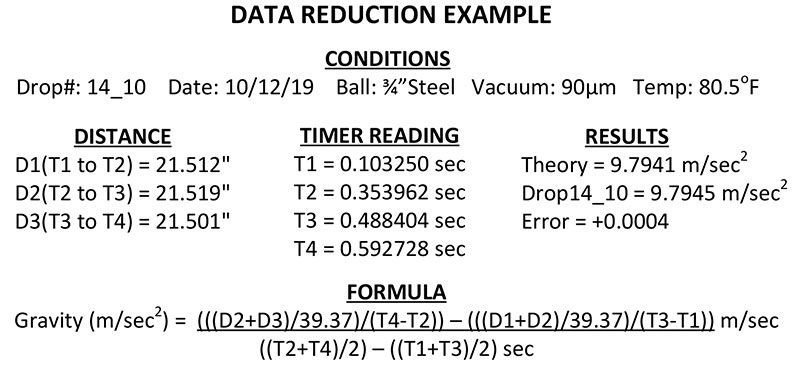
FIGURE 12. Data reduction involved using the distances between the photodiodes and the transit times between them. Dozens of drops produced similarly accurate results.
Now that I had nailed four significant digits, perhaps I should go for five? Maybe I could do a better job of controlling the temperature gradient along the tower? Or, I could get really serious about a comprehensive error analysis. Or, how about improving the distance measurements by buying a 72” NIST certified ruler from McMaster for only $805.11?
Seriously though, I had already spent four months part-time on this project and had achieved results that were far better than I had ever expected. It was probably time to move on. So, I packed up the tower, put it in the shed, and turned my attention to the next fun project: a Z-pinch machine.
I always welcome any comments or corrections at [email protected]. NV
POSTSCRIPT
When I was initially assembling the tower and mounting the timers, I encountered a mechanical interference problem, as clearly illustrated in Figure 13. My question to you is this: Did I cut a notch in the aluminum diagonal support or did I bandsaw a groove in the gray timer cover?
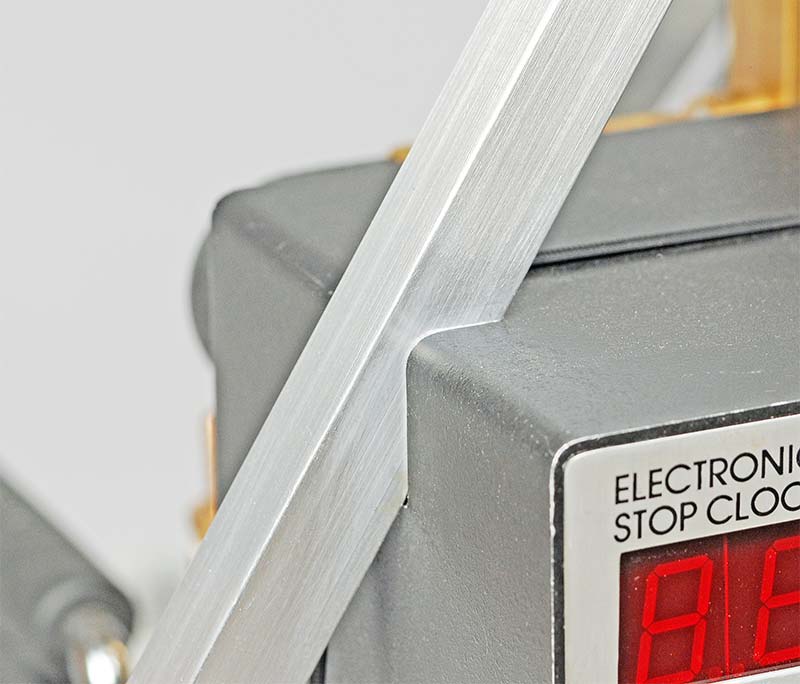
FIGURE 13. Houston, we have a problem. Back to the drawing board.
Parts List
| Designator |
Component |
Digi-Key, unless noted |
| R1 |
Resistor, 360, 1/4W |
360QBK-ND |
| R2 |
Resistor, 20K, 1/4W |
20KQBK-ND |
| R3 |
Resistor, 10K, 1/4W |
10KQBK-ND |
| R4 |
Resistor, 1 meg, 1/4W |
1.0MQBK-ND |
| R5 |
Resistor, 20 ohms, 5W |
696-1072-ND |
| R6-R13 |
Resistor, 51K, 1/2W |
51KQBK-ND |
| C1 |
Capacitor, 0.1 mfd, 50V |
399-4151-ND |
| D1 |
Diode, Schottky, 1N5818 |
1N5818DICT-ND |
| Q1 |
Transistor, NPN, 2N3904 |
2N3904FS-ND |
| Q2 |
FET, Power, IRLU120NPBF |
IRLU120NPBF-ND |
| U1 |
IC, Inverter, 74LS04 |
296-1629-5-ND |
| U2 |
IC, Buffer/Driver, 74LS244 |
296-1653-5-ND |
| U3, U4, U5, U6 |
Op-amp, LMC6484 |
LMC6484IN/NOPB-ND |
| OSC1 |
Oscillator, 1.0000 MHz |
CTX150-ND |
| MAG1 |
Electromagnet, 6V, 326 mA |
eBay, China |
| ARD1 |
Arduino Micro |
1050-1066-ND |
| T1, T2, T3, T4 |
Timer & Photogate |
eBay, Cenco |
| PS1 |
Power Supply, 12V, 2A |
285-1884-ND |
| PS2 |
|
eBay, HP-6235A |
| BP1 |
Buzzer, Piezo |
Jameco 335557 |
| SW1 |
Pushbutton, Handheld |
eBay, Switchcraft |
| PUMP |
Pump, Vacuum, 2.5CFM |
Harbor Freight |
| SENSOR |
Tube, Vacuum TC, DV-3M |
eBay, Misc |
| GAUGE |
Gauge, Vacuum |
eBay, Veeco |