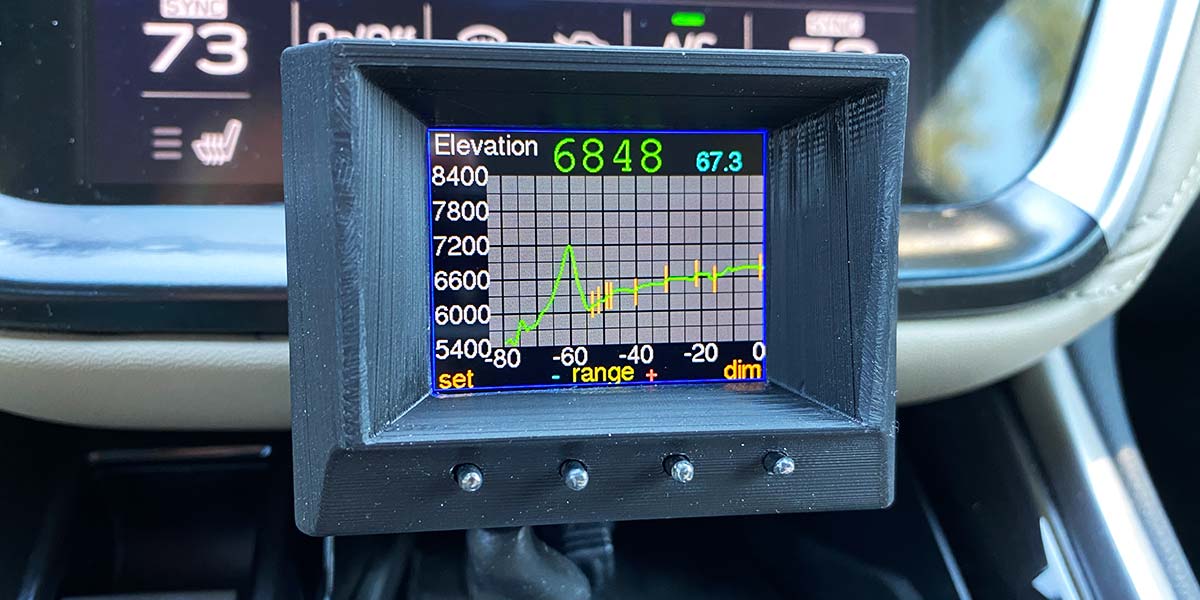
What is my current elevation? If I’m driving in the mountains, I like to see my progress up or down on my trip. If I’m hiking in the mountains, I would like to know what elevation I’m at and how much it has changed over the course of my hike.
This altimeter gives your current elevation and tells where you’ve been with a graph. For the car, it gives graphs over four different time ranges from 40 minutes to five hours. For hiking, it gives graphs over four different time ranges from two hours to 20 hours. It can read in imperial units of feet and inches of mercury (inHg), or in metric units of meters and hectopascals (hPa). It also reads the temperature.
My altimeter is based on a barometric pressure sensor. This is considered the most accurate measurement of altitude, and is the method chosen by aviation. GPS will also tell you the elevation but can be off by as much as 200 feet — especially if there isn’t a good enough connection with enough satellites.
Aircraft set their altimeters to the barometric pressure at sea level. This can be obtained from the weather forecast or from the information available from a nearby airport by searching for METAR and the airport location. (METAR is a format for reporting weather information.)
It’s standard procedure for aircraft to set the sea level pressure (also known as QNH, or Nautical Height) at the beginning of each flight. Airplanes are supposed to recheck this pressure every 100 miles of flight, except when flying above 18,000 feet; then the pressure is set to a standard of 29.92 inHg.
This altimeter can be set to the sea level pressure, but also can be set to the elevation. Since I’m often starting at home and I know the elevation there, it’s easiest to reset it to my home elevation.
Changes in barometric pressure can cause the elevation to read differently, so a double-click on button 4 sets the elevation to my home location at 433 feet at the beginning of a trip.
This number can be changed to your home elevation in the Arduino code, by changing the constant homeAltitude. A relatively accurate measure of elevation can be obtained from geographical surveys, from a website like www.whatismyelevation.com, or a phone app such as “My Altitude” can be used to look up your home elevation.
When you arrive at a destination and turn your car off, the altimeter goes off too. The barometric pressure may change between then and the next time you start your car. Since the elevation doesn’t change, this altimeter resets the sea level pressure to reset the elevation to where you left off.
Every time the altimeter is turned on, an orange mark is put on the graph to mark this event. Every time you recalibrate the reading, a white mark is put on the graph. When you change to Hiking Mode, a white mark is put on the graph.
Putting It Together
The heart of this altimeter is the barometric pressure sensor BMP390. A Teensy 4.0 (or a Teensy 3.2) microcontroller reads the altitude every five seconds and records the highest of every four measurements every 20 seconds. It graphs the results over the selected time range on a two inch 240x320 TFT color display (Figure 1).

FIGURE 1. The screen shown mounted on the PCB. It’s plugged into the half-DIP socket on the left.
The vertical scale of the elevation graph is adjusted for the best fit of the graph over the space available and adjusts the labels for the Y axis accordingly.
Whenever the data is logged in the MCU, it’s also backed up onto a FRAM memory chip, preserving the data for when the altimeter is turned off. This enables the altimeter to remember settings and data that can be restored on restart, allowing everything to be just like it was the last time it was used. It’s powered through the five volt USB socket in the car.
For hiking, it’s powered from three AAA batteries in a holder taken from a cheap LED flashlight.
All the parts mount on a printed circuit board (PCB) which I ordered through ExpressPCB, using their standard MiniBoard format. There are lines telling you where to cut the board to a smaller size. The display plugs into a 22-pin DIP socket which has been cut in half, and the half with 11 pins is on the front of the board.
The four buttons are also on the front of the board, and all the other components are mounted on the back of the board (Figure 2).

FIGURE 2. The smart parts mounted on the PCB, plugged into DIP sockets.
The small boards of the “smart parts” are plugged into DIP sockets. Most small components are through-hole, but six surface-mount resistors are used for compactness. These are not super tiny and are easy to solder with a small tip and some flux.
The header pins on the Teensy MCU and the other smart parts are cut to 5/32” in length to reduce their height and allow them to fit into a smaller enclosure. The circuit can be seen in Figure 3.

FIGURE 3. Altimeter circuit diagram.
The electronics are mounted in a 3D printed enclosure. Since the buttons are sunken down in level from the surface of the screen, small nails slide in holes through the back of the front cover. The heads press on the top of the buttons, and the shaft of the nail is cut, rounded, and polished to become the top of the button when the cover is in place. All the electronics are mounted to the inside of the front cover.
The case back is printed in two pieces: the case back itself, and a small piece that is glued on the back to create a slot for mounting. It uses #2-56 black flat-head machine screws to attach the front/circuit to the back cover (3/16” long at the top and 5/16” long at the bottom), and #2-56 round-head machine screws and spacers to attach the circuit board to the inside of the front.
I originally intended to power the unit through the mini-USB connector on the Teensy PCB. This causes problems if the data lines are connected, as the car is trying to communicate with an unknown device.
Also, the connection is not very reliable after plugging and unplugging a bunch of times. A separate power jack solved these problems.
I used Sugru putty which hardens into rubber to create a custom right-angle power connector on a custom length wire for a neat, compact installation. I cut off the back of a power plug housing, clamped the wire into a right-angle position, and applied the Sugru to shape it into a new plug.
There’s a slot on the back of the altimeter so that it can slide onto an aluminum tab, which is part of a plate that slides into a compartment on the car’s instrument panel (Figure 4).

FIGURE 4. Custom power cable and mounting plate for my car’s cubby hole.
If you don’t have a 3D printer or don’t want to use a service to print the case for you, any box can work. My first prototype was in a small plywood box. An important feature is to have a shade to shield the top and sides of the display, as the little backlight has a hard time competing with a bright sunny day. Ventilation holes help it cool off after spending time in a hot, closed-up car.
Elevation data is recorded in a circular array, with the pointer to the beginning of the array showing the latest data point. Each new piece of data replaces the oldest and the pointer is incremented to the new beginning.
The code is written in the Arduino editor. After installing the Teensy Loader program (www.pjrc.com/teensy/loader.html), the Teensy will appear in the Tools menu. Instructions on that website walk you through the installation process. Once it’s installed, programming the Teensy is the same as for any Arduino program. You can use a Teensy 4.0 or a Teensy 3.2, but be sure to set the IDE (integrated development environment) for the one that you’re using.
The following libraries need to be installed into your Arduino Libraries folder:
- Adafruit_Unified_Sensor
- Adafruit_BMP3XX_Library
- Adafruit_GFX_Library
- Adafruit_FRAM_I2C
- Adafruit_ST7735_and_ST7789_Library
For the first time loading, two parts of the setup section of the code should be changed, starting at lines 227 and 261. One part loads some fake data so you can see something on your screen; that should be un-commented to allow it to work. The other allows the restoration from the FRAM memory and should be commented out because the first time will have the FRAM memory full of garbage.
After the program has run for a short time, the restored lines can be un-commented, and the loading of fake data can be commented out. Some sections of code can be customized for your preferences. They’re marked with #### to make it easy to find these spots.
They include the first-time sections of code just mentioned and the value for your homeAltitude that makes it easy to calibrate the altimeter when leaving home. It also includes values related to battery life calculation if you choose to power with batteries other than AAAs for Hiking Mode. I made a real effort to put a lot of comments in the code to explain each section and make it easier to find parts you may want to change.
Determining the Elevation
Elevation (h, or height in meters above sea level) is calculated based on the barometric pressure at sea level (Po), the local barometric pressure (P), and the temperature (T in degrees Kelvin). It’s calculated using the barometric formula:

I use the appropriate conversion factors to get my answer in feet. As mentioned, the pressure readings can be in imperial (inHg) or metric (hPa) because the ratio is the same either way as long as both pressures are in the same system. When the altimeter is used in metric mode, I convert my answer back to meters.
Thankfully, the Teensy allows me to calculate a number raised to a fractional power. It won’t allow the reverse calculation using logarithms, so when I want to calculate the change in sea level pressure for resetting the elevation h to the most recent value on startup, I used a workaround in the code to achieve that, which is explained in the comments in the code.
When the altimeter is configured to Hiking Mode, the elevation is measured every 20 seconds and recorded every 80 seconds (Figure 5).

FIGURE 5. Altimeter clipped onto a backpack strap, ready to hike.
Since three AAA batteries power it, to preserve battery life the display blanks after 20 seconds or after button 4 is pushed.
Pressing any button wakes up the display. If the screen is lit for a total of 20 seconds every hour to check the readings, the batteries last about 29 hours. If the screen is left on all the time, the batteries last about 12 hours. I used a small piece of sheet aluminum to engage the slot at the back of the altimeter, and a rubber band to wrap around the back of the backpack strap to hold it in place (Figure 6).

FIGURE 6. Mounting plate for backpack strap and battery power supply for hiking.
Four Buttons Control the Function of the Altimeter
Button 1 selects settings and calibration. The first press of button 1 goes to the set elevation screen (Figure 7), where buttons 2 and 3 allow the elevation to be decreased or increased.

FIGURE 7. Screen for adjusting the elevation.
Button 4 saves the setting and exits back to the graph. This method is the most accurate if you know your elevation. The second press of button 1 allows the nautical height (sea level) pressure to be set. As mentioned, this number can be obtained from the nearest airport or a phone weather app.
A third press of button 1 brings up a configuration screen (Figure 8).

FIGURE 8. Configuration screen.
There, button 4 allows Hiking Mode to be turned on or off. Button 3 allows the units of measurement to switch between imperial or metric. Button 2 allows the battery life percentage display to be reset to 100% when you change to new batteries.
The fourth press of button 1 allows the pressure to be set to the average 29.92 inHg. If you don’t know your altitude or the pressure, this will get your readings to wild-guess close.
From the graph screen, a single click of button 4 gives an information screen that displays the elevation, nautical height pressure, local pressure, and temperature, and another press goes back to the graph.
A double-click of button 4 (not labeled) resets the elevation to your home elevation that you’ve put into the code with the homeAltitude parameter in the declarations section of the code. This is a quick way of setting the elevation when beginning a trip.
Other buttons could be similarly configured in the code to make a double-click to set a second elevation.
Accuracy
Since elevation is calculated based on the barometric pressure at sea level (P˚) and the local barometric pressure (P), the elevation will appear to change even if the altitude is not changing. Observing my graphing weather station, I see that on a day that the pressure varies a lot, it can change 0.08 inHg in 12 hours, or roughly 80 feet in elevation. Observing a map plotting pressure in different areas, I noticed that the apparent elevation can change another 80 feet in one hour of driving time. This is in the relatively calm climate of California, and I understand that in other parts of the world the pressure can vary even more — especially during storm conditions.
The elevation also varies with the temperature. At 68°F and 500 feet elevation, a 1°F change will give about a one foot change in elevation. If the altimeter is in a car closed up in the summer, the interior temperature becomes high (130°F is not uncommon). That can cause inaccurate distortion of the elevation since the barometric pressure inside the car is the same as the cooler outside temperature, so I ignore temperatures above 90 in my calculations.
I’m using a BMP390 pressure sensor, which is supposed to be accurate to one foot elevation. I also tried the BMP388 sensor (accurate to about six feet), and am not sure I saw a noticeable difference. When I drive to the top of a hill and stop, the elevation reading keeps going up for another 20-30 seconds before it stabilizes. This likely has a bigger effect on the elevation reading than the accuracy difference between the two sensors.
So, do these inaccuracies matter very much? Since I’m not trying to land a flying vehicle by pressure-determined altitude, I think not. In general, while driving in the mountains, the elevation seems to stay accurate within 20-30 feet most of the time. The pressure being reset when the car starts up seems to compensate for changes that happen during the day when the car is not being driven. Often, I can leave home in the morning, drive up and down hills, stop somewhere, and when I get home the altitude reads very close to where it was when I left.
Final Ascent
I think it’s fun to know the altitude where I am. While travelling, it’s difficult to pay close attention to the elevation of each moment, and the graph allows me to see where I have been in elevation. I can see the peaks and valleys of my journey, even if I wasn’t able to view the readings at those moments. NV
PARTS LIST
| Qty |
Part |
Number |
Supplier |
| 1 |
Teensy 4.0 Microcontroller |
1568-DEV-16997-ND |
www.digikey.com |
| 1 |
Adafruit 1895 FRAM I2C |
1528-1035-ND |
www.digikey.com |
| 1 |
Adafruit 4816 BMP390 Altimeter |
1528-4816-ND |
www.digikey.com |
| 1 |
Adafruit 4311 Display 2” |
1528-4311-ND |
www.digikey.com |
| 1 |
100 µF Electrolytic Capacitor |
399-6118-ND |
www.digikey.com |
| 4 |
330Ω SMD Resistors 1206 |
A130174CT-ND |
www.digikey.com |
| 2 |
4.7KΩ SMD Resistors 1206 |
311-4.70KFRCT-ND |
www.digikey.com |
| 1 |
22-position DIP Socket |
AE10264-ND |
www.digikey.com |
| 1 |
28-position DIP Socket |
609-4715-ND |
www.digikey.com |
| 4 |
Tactile Switches |
149948 |
www.jameco.com |
| 1 |
Male Power Jack |
137673 |
www.jameco.com |
| 1 |
16-position DIP Socket |
2246080 |
www.jameco.com |
| 7 |
#2-56 Machine Screws |
|
www.mcmaster.com |
| 4 |
Nails for Button Extension |
|
|
| |
Sugru Putty |
|
www.amazon.com |
Downloads
What’s In the Zip?
Arduino Code
Fusion 360 Design File for the Case
The stl Files for 3D Printing the Case
ExpressPCB Files