Construct a Novel and Inexpensive Medical Instrument for Fun, Discovery, and Teaching
Listening to the sounds emitted from the heart using a stethoscope (auscultation) is a frequent first step in cardiac diagnosis (Figure 1). Cardiac auscultation is often followed by echocardiography (ultrasound examination and imaging of the heart) when the auscultatory findings are abnormal. However, the limited reliability of ordinary auscultation in the hands of ordinary clinicians and the expense and awkwardness of echocardiography may make it desirable to develop a more advanced approach to cardiac auscultation using computer-based techniques (digital phonocardiography).
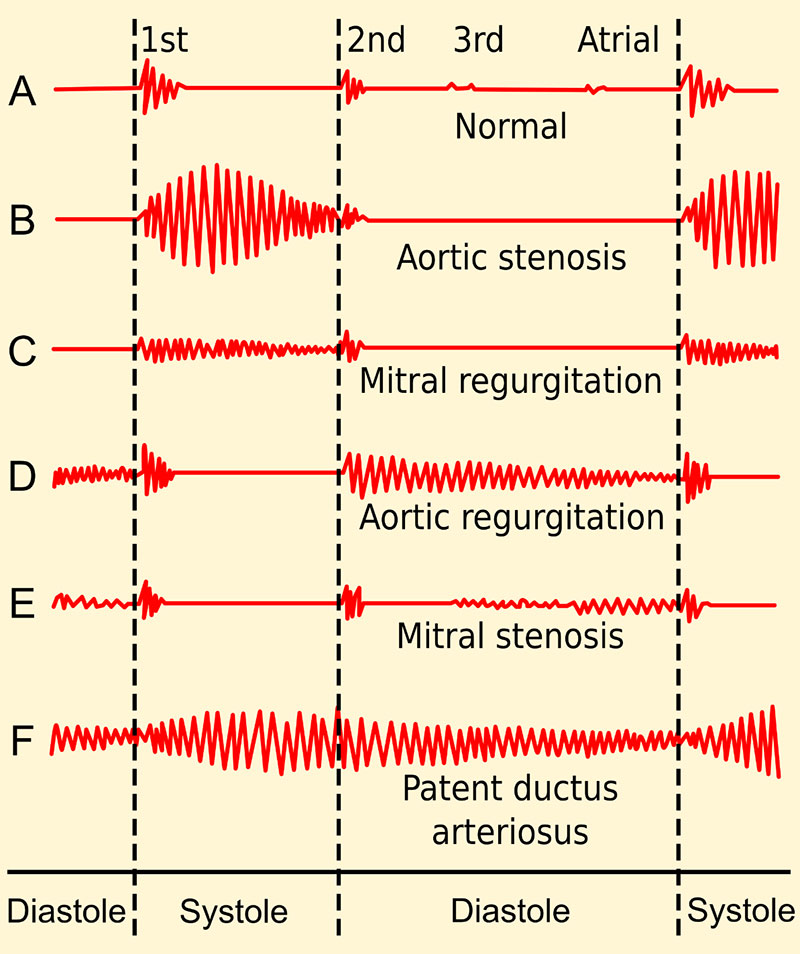
FIGURE 1. Stylized/conceptual phonocardiogram (heart sound) samples corresponding to several cardiac conditions. Image Credit: Used under a Creative Commons License. By Madhero88 - Own work, CC BY-SA 3.0, https://commons.wikimedia.org/w/index.php?curid=9663236.
In this article, I’ll show you how through the addition of an inexpensive USB (Universal Serial Bus) miniature microphone one can convert an ordinary stethoscope and a Windows laptop computer into a phonocardiogram system (heart sound analyzer), offering advanced features such as phonocardiogram storage and retrieval, low-pass and high-pass waveform filtering, and signal playback at selectable speeds with pitch preservation.
Constructing the System
To convert a Windows laptop computer into a phonocardiogram system, you only need to add two elements. The first is the needed software (Audacity, discussed below) and the second is an easily constructed USB stethoscope that plugs into the USB port of the laptop computer.
To construct the USB stethoscope, you begin by obtaining a USB lavalier microphone (Figure 2) and connecting it to a stethoscope head via a short piece of tubing (Figure 3).
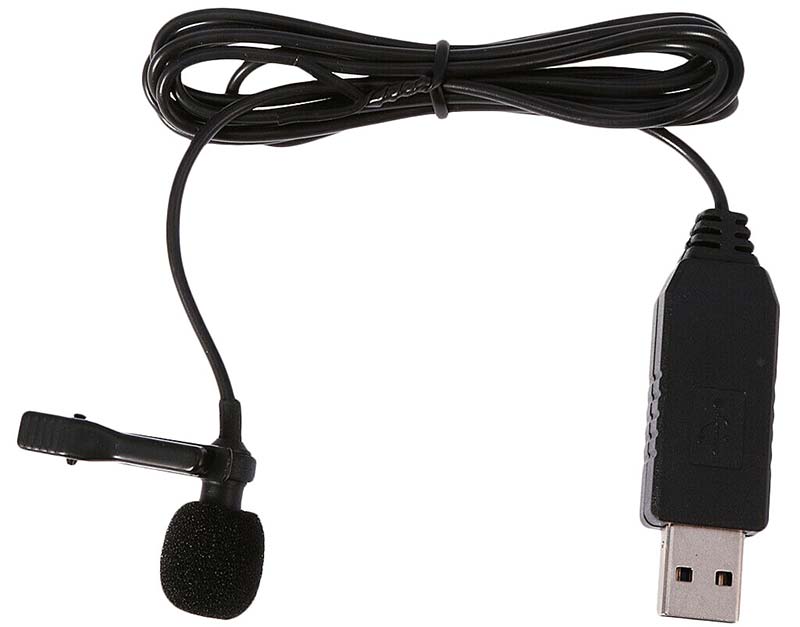
FIGURE 2. This miniature electret microphone with an integral USB interface was purchased on eBay for under $10, including shipping (https://www.ebay.com/itm/224786847174?hash=item34565715c6:g:-AEAAOSwOVlh3tON). When used for phonocardiography applications, the lapel clip and the foam microphone cover are discarded and the unit is attached to a stethoscope head via a short piece of tubing (Figure 3).
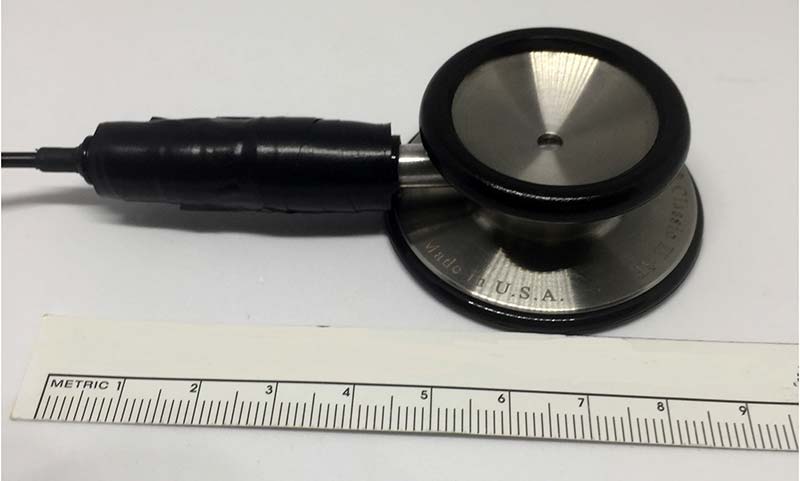
FIGURE 3. The miniature electret microphone shown in Figure 2 acoustically connected to a 3M Littman Classic II SE stethoscope head via a short piece of tubing. Hobbyists with a limited budget will likely find that the use of a stethoscope head removed from an ordinary stethoscope costing under $10 will do just fine.
Once the assembly is plugged into the laptop’s USB port, it will be necessary to ensure that the new microphone is recognized. To do this under Windows 10, you must go to the Windows “Settings” menu and select the “Sound” tab. With successful registration of the new microphone, you should see something akin to the information displayed in Figure 4.
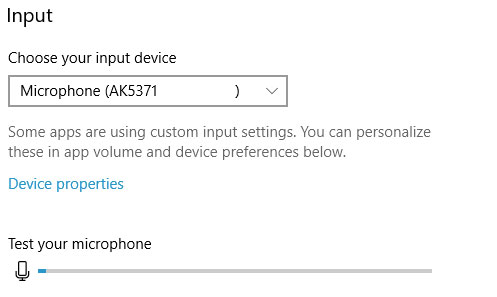
FIGURE 4. Screenshot of part of the Sound portion of the Settings menu in Windows 10. In the case of the microphone shown in Figures 2 and 3, the device goes by the name AK5371, but a different name might be expected when using a different USB microphone. The “Test your microphone” feature displayed on the bottom of the panel allows users to watch the bar graph amplitude change as they speak into the microphone under test.
The Audacity Software Package
Central to this project is the Audacity software package. Audacity is a particularly well-supported and well-documented open source digital audio editor and recording application available for the Windows, Mac OS/OS X, and Linux operating systems. It can be freely downloaded at https://www.audacityteam.org/. Figure 5 shows a brief musical passage (Beethoven’s Symphony No. 5 in C Minor) being processed using Audacity.
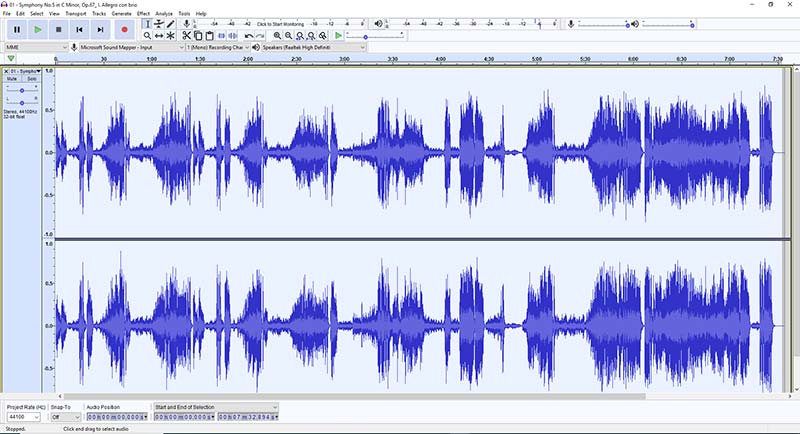
FIGURE 5. Screenshot of the Audacity audio software package displaying the first portion of Beethoven’s famous Symphony No. 5 in C Minor. This powerful, free, open source software package offers numerous features for processing audio signals — many of which are of potential value for phonocardiography applications.
Although Audacity has an almost overwhelming array of features and options, three classes of features found in the “Effect” menu are likely to be of special interest to phonocardiographers.
These include: [1] the Amplify feature that scales the signal; [2] the Normalize feature that “normalizes” the signal to a chosen maximum amplitude (e.g., 0 dB); and [3] three digital filtering options (Low-Pass Filter, High-Pass Filter, and Notch Filter).
One final feature known as “Change Tempo” that may captivate some users is the ability to change the speed of a recording without changing the sound pitch — a feature of potential value in listening to heart sounds in patients with a fast heart rate (tachycardia).
A YouTube video demonstrating the basics of using Audacity is available at https://www.youtube.com/watch?v=LQ7n9pA0qc0.
Sample Recording
Figure 6 shows a sample phonocardiogram recording I obtained with the USB stethoscope placed over the second left intercostal space adjacent to the sternal border (pulmonic valve area).


FIGURE 6. Sample phonocardiogram recording obtained under breath-holding (apneic) conditions. The recording is from me with the USB stethoscope placed over my second left intercostal space adjacent to the sternal border (pulmonic valve area). Top: First 13.3 seconds of the recording. Middle: “Zoomed in” portion of the above phonocardiogram showing the first 3.3 seconds of the recording, making the first and second heart sounds somewhat more distinct. Bottom: First 3.3 seconds of the recording after high-pass filtering (200 Hz, 6 dB/octave roll off) and normalization. Notice how this filtering operation helps make the separate heart sounds more distinct.
The top portion of Figure 6 shows 13.3 seconds of the phonocardiogram recording, comprising approximately 16 cardiac cycles.
Investigators wanting to “zoom in” on a portion of the recording so as to be able to examine events more closely can easily do so with the Audacity waveform “zoom” feature.
As illustrated in the middle panel of Figure 6, the zoomed-in phonocardiogram now shows only the first 3.3 seconds of the recording, making the first and second heart sounds somewhat clearer.
Finally, the bottom of Figure 6 shows the same 3.3 seconds of the recording after high-pass filtering (200 Hz, 6 dB/octave roll off) and normalization. Notice how this high-pass filtering operation helps make the separate heart sounds even more distinct.
Color Spectrographic Analysis of the Phonocardiogram
It will be of interest to some readers that additional signal processing techniques have been described that might be applied to phonocardiograms collected using the described system.
As an example, color spectrogram analysis of phonocardiogram signals allows phonocardiography to be carried out in the frequency domain.
Figure 7 shows the phonocardiogram presented in Figure 6 analyzed in this manner using the Spectrogram16 software package, available as a free download at https://auditoryneuroscience.com/sites/default/files/gram16_setup.zip.
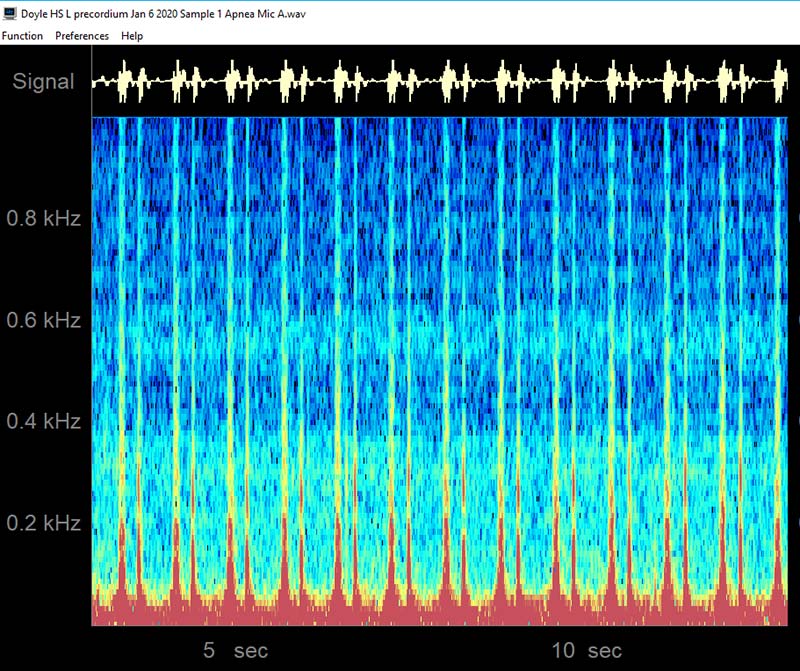
FIGURE 7. The color spectrogram of the phonocardiogram signal shown in Figure 6 obtained using the Spectrogram16 software package. Note that the specific image obtained will depend strongly on the analysis parameters chosen (e.g., FFT size, frequency resolution, maximum and minimum spectrum levels, and chosen upper and lower frequency band limits). Red areas indicate the strongest signal levels, blue areas the weakest nonzero levels: BLACK < BLUE < GREEN < YELLOW < RED.
Recording Sounds (Acoustic Emissions) from Other Structures
Besides recording sounds from the heart, the above arrangement can also be used to record laryngeal ocalization patterns, lung sounds, tracheal sounds (recorded at the neck), and even bowel sounds.
As an example, Figure 8 shows a sample color spectrogram from a breath sound recording taken using a microphone embedded in an oxygen mask.
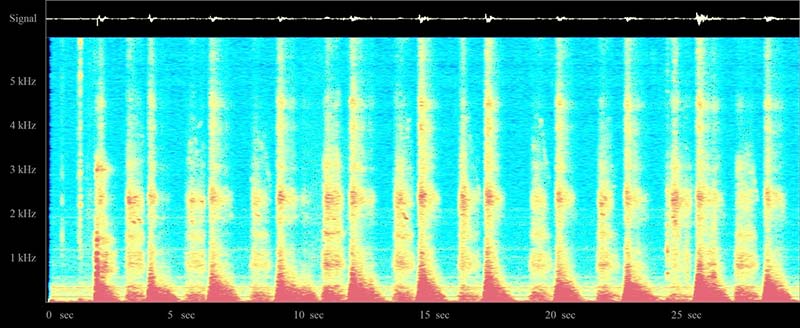
FIGURE 8. Sample respiratory sound spectrogram I recorded using a miniature electret microphone embedded in an oxygen mask. The range of frequencies displayed in this figure is 0 Hz to 6000 Hz, with the highest frequency signal components at the top and the lowest at the bottom. Red areas indicate the strongest signal levels, blue areas the weakest nonzero levels: BLACK < BLUE < GREEN < YELLOW < RED. Note that both inspiration and expiration are clearly visible. The time-domain signal is displayed at the very top of the image.
Safety Note
Please operate your laptop in battery mode (not plugged in) when recording using a microphone that makes physical contact with people. “Abundance of caution” reasoning applies.
Conclusion
Through the addition of an inexpensive USB miniature microphone and the free open source Audacity software package, one can convert a laptop computer into a phonocardiogram system offering features such as phonocardiogram file storage and retrieval and digital waveform filtering. The system described herein will interest many students and teachers interested in exploring the art and science of digital phonocardiography.
Perhaps the most appealing aspect of this system is its extremely low cost to individuals owning a laptop computer and willing to sacrifice a stethoscope, as the software used is available as free downloads and the USB microphone used for this project only cost a mere $7. NV
Downloads
What’s In The Zip?
Audacity Program for Windows
What’s In The Zip?
Sound Recordings WAV Format
What’s In The Zip?
Spectrogram 16 Program


